一、influxDB简介
InfluxDB是一款用Go语言编写的开源分布式时序、事件和指标数据库,无需外部依赖。该数据库现在主要用于存储涉及大量的时间戳数据,如DevOps监控数据,APP metrics, loT传感器数据和实时分析数据。
二、安装
(py3) [root@zabbix_server src]# wget https://dl.influxdata.com/influxdb/releases/influxdb-1.1.0.x86_64.rpm
--2019-10-30 15:22:01-- https://dl.influxdata.com/influxdb/releases/influxdb-1.1.0.x86_64.rpm
正在解析主机 dl.influxdata.com... 13.226.77.23, 13.226.77.76, 13.226.77.125, ...
正在连接 dl.influxdata.com|13.226.77.23|:443... 已连接。
已发出 HTTP 请求,正在等待回应... 200 OK
长度:15343957 (15M) [application/x-redhat-package-manager]
正在保存至: “influxdb-1.1.0.x86_64.rpm”

39% [=============================> ] 6,019,708 1.77M/s eta(英国中部时42% [================================> ] 6,543,996 1.80M/s eta(英国中部时51% [=======================================> ] 7,838,332 2.01M/s eta(英国中部时57% [============================================> ] 8,755,836 2.00M/s eta(英国中部时60% [===============================================> ] 9,345,660 2.10M/s eta(英国中部时63% [=================================================> ] 9,771,644 2.18M/s eta(英国中部时71% [=======================================================> ] 10,934,908 2.58M/s eta(英国中部时74% [=========================================================> ] 11,426,428 2.62M/s eta(英国中部时77% [============================================================> ] 11,950,716 2.71M/s eta(英国中部时83% [================================================================> ] 12,786,300 2.71M/s eta(英国中部时86% [===================================================================>           ] 13,326,972 2.81M/s eta(英国中部时90% [======================================================================> ] 13,867,644 2.75M/s eta(英国中部时94% [=========================================================================> ] 14,539,388 2.63M/s eta(英国中部时100%[==============================================================================>] 15,343,957 2.77M/s in 6.7s

2019-10-30 15:22:09 (2.18 MB/s) - 已保存 “influxdb-1.1.0.x86_64.rpm” [15343957/15343957])

(py3) [root@zabbix_server src]# yum localinstall influxdb-1.1.0.x86_64.rpm
已加载插件:fastestmirror, security
设置本地安装进程
诊断 influxdb-1.1.0.x86_64.rpm: influxdb-1.1.0-1.x86_64
influxdb-1.1.0.x86_64.rpm 将被安装
Loading mirror speeds from cached hostfile
* base: mirrors.aliyun.com
* extras: mirrors.aliyun.com
* updates: mirrors.aliyun.com
* webtatic: uk.repo.webtatic.com
base | 3.7 kB 00:00
dell-system-update_dependent | 2.3 kB 00:00
dell-system-update_independent | 2.3 kB 00:00
extras | 3.4 kB 00:00
mysql-connectors-community | 2.5 kB 00:00
mysql-tools-community | 2.5 kB 00:00
mysql57-community | 2.5 kB 00:00
nginx | 2.9 kB 00:00
updates | 3.4 kB 00:00
webtatic | 3.6 kB 00:00
解决依赖关系
--> 执行事务检查
---> Package influxdb.x86_64 0:1.1.0-1 will be 安装
--> 完成依赖关系计算

依赖关系解决

========================================================================================================================
软件包 架构 版本 仓库 大小
========================================================================================================================
正在安装:
influxdb x86_64 1.1.0-1 /influxdb-1.1.0.x86_64 47 M

事务概要
========================================================================================================================
Install 1 Package(s)

总文件大小:47 M
Installed size: 47 M
确定吗?[y/N]:y
下载软件包:
运行 rpm_check_debug
执行事务测试
事务测试成功
执行事务
正在安装 : influxdb-1.1.0-1.x86_64 1/1
Verifying : influxdb-1.1.0-1.x86_64 1/1

已安装:
influxdb.x86_64 0:1.1.0-1

完毕!
三、文件说明
在/usr/bin目录下有如下文件
(py3) [root@zabbix_server bin]# ll inf*
-rwxr-xr-x  1 root root  6192647 11月 12 2016 influx
-rwxr-xr-x  1 root root 16898710 11月 12 2016 influxd
-rwxr-xr-x  1 root root  5964784 11月 12 2016 influx_inspect
-rwxr-xr-x  1 root root  7857550 11月 12 2016 influx_stress
-rwxr-xr-x  1 root root 12534956 11月 12 2016 influx_tsm
-rwxr-xr-x. 1 root root   186096 8月  20 2010 info
-rwxr-xr-x. 1 root root    55720 3月  16 2015 infocmp
-rwxr-xr-x. 1 root root    25664 8月  20 2010 infokey
lrwxrwxrwx. 1 root root        3 11月 28 2018 infotocap -> tic
influxd:服务器 influx:客户端 数据文件存放在 /var/lib/influxdb/目录下
四、数据库操作
启动服务器
(py3) [root@zabbix_server influxdb]# influxd

 8888888           .d888 888                   8888888b.  888888b.
   888            d88P"  888                   888  "Y88b 888  "88b
   888            888    888                   888    888 888  .88P
   888   88888b.  888888 888 888  888 888  888 888    888 8888888K.
   888   888 "88b 888    888 888  888  Y8bd8P' 888    888 888  "Y88b
   888   888  888 888    888 888  888   X88K   888    888 888    888
   888   888  888 888    888 Y88b 888 .d8""8b. 888  .d88P 888   d88P
 8888888 888  888 888    888  "Y88888 888  888 8888888P"  8888888P"

[run] 2019/10/30 15:45:39 InfluxDB starting, version 1.1.0, branch master, commit 800da5732b91c816b0a097acf8887fa2af1efa1a
[run] 2019/10/30 15:45:39 Go version go1.7.3, GOMAXPROCS set to 24
[run] 2019/10/30 15:45:39 Using configuration at: /etc/influxdb/influxdb.conf
[store] 2019/10/30 15:45:39 Using data dir: /var/lib/influxdb/data
[subscriber] 2019/10/30 15:45:39 opened service
[monitor] 2019/10/30 15:45:39 Starting monitor system
[monitor] 2019/10/30 15:45:39 'build' registered for diagnostics monitoring
[monitor] 2019/10/30 15:45:39 'runtime' registered for diagnostics monitoring
[monitor] 2019/10/30 15:45:39 'network' registered for diagnostics monitoring
[monitor] 2019/10/30 15:45:39 'system' registered for diagnostics monitoring
[shard-precreation] 2019/10/30 15:45:39 Starting precreation service with check interval of 10m0s, advance period of 30m0s
[snapshot] 2019/10/30 15:45:39 Starting snapshot service
[continuous_querier] 2019/10/30 15:45:39 Starting continuous query service
[httpd] 2019/10/30 15:45:39 Starting HTTP service
[httpd] 2019/10/30 15:45:39 Authentication enabled: false
[httpd] 2019/10/30 15:45:39 Listening on HTTP: [::]:8086
[retention] 2019/10/30 15:45:39 Starting retention policy enforcement service with check interval of 30m0s
[monitor] 2019/10/30 15:45:39 Storing statistics in database '_internal' retention policy 'monitor', at interval 10s
2019/10/30 15:45:39 Sending usage statistics to usage.influxdata.com
[run] 2019/10/30 15:45:39 Listening for signals
启动客户端
(py3) [root@zabbix_server dianwang]# influx
Visit https://enterprise.influxdata.com to register for updates, InfluxDB server management, and monitoring.
Connected to http://localhost:8086 version 1.1.0
InfluxDB shell version: 1.1.0
>
创建数据库
> create database test;
> show databases;
name: databases
name
----
_internal
test
打开数据库
> use test
Using database test
>
创建表,InfluxDB没有提供单独的建表语句,可以通过并添加数据的方式建表
> insert test,province=安徽 count=464
> show measurements
name: measurements
name
----
test

> select * from test
name: test
time                    count   province
----                    -----   --------
1572422964532967343     464     安徽
添加数据
> insert test,province=广东 count=1702
> select * From  test
name: test
time                    count   province
----                    -----   --------
1572422964532967343     464     安徽
1572423041812200700     1702    广东
删除表
> drop measurement test
> show measurements
>
五、grafana添加influxdb数据源
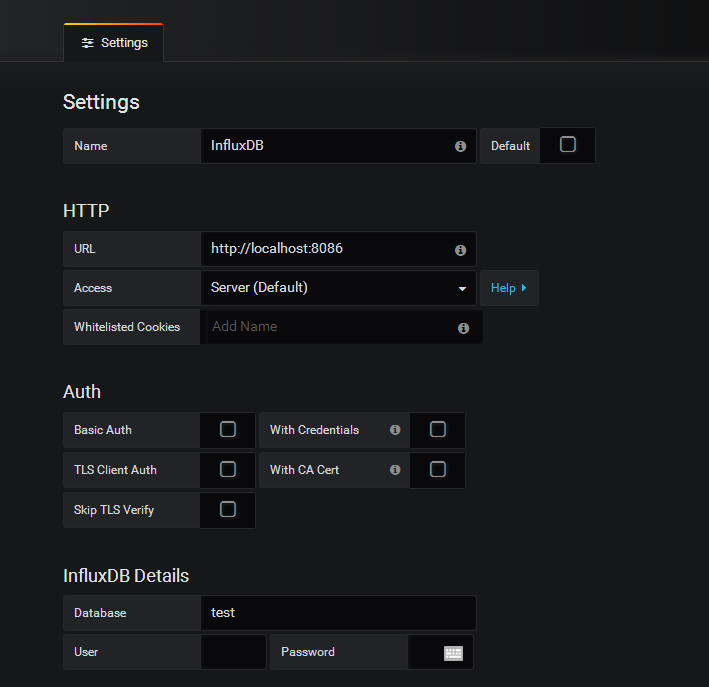
添加表格插件,设置如下:
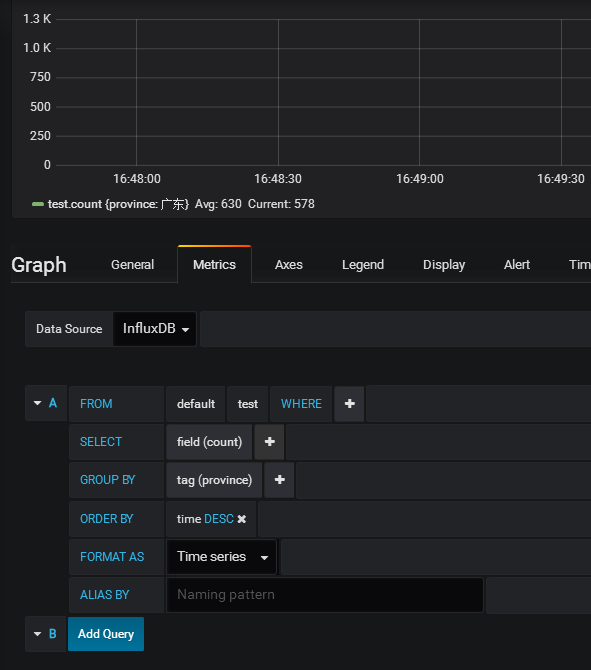
选择展示字段:count,按province分组,按时间排序
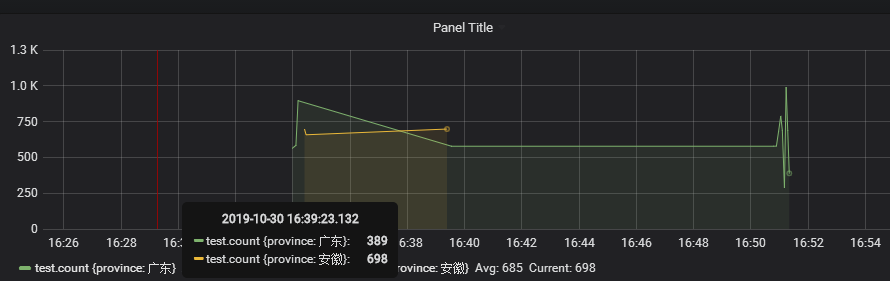
这样就完成了数据的展示。
六、安装grafana的worldsmap插件
[root@zabbix_server bin]# ./grafana-cli plugins install grafana-worldmap-panel
installing grafana-worldmap-panel @ 0.2.1
from url: https://grafana.com/api/plugins/grafana-worldmap-panel/versions/0.2.1/download
into: ../data/plugins

? Installed grafana-worldmap-panel successfully

Restart grafana after installing plugins . <service grafana-server restart>
七、重启grafana服务
root@zabbix_server bin]# ./grafana-server start
查看面板

地图插件已经安装上了
八、创建地图数据表(坐标模式)