最近在做一个关于图形统计的界面,主要用到的是Dev控件ChartControl(功能很强大,能解决基本和复杂图形统计问题)。
ChartControl主要有Diagram、Series、Legend三个重要属性
diagram主要是用来控制图形X、Y、Z轴显示的样式和是否允许旋转以及旋转的角度和绕那个轴旋转。
series主要是用来给chartcontrol控件增加各种图形,图形的种类用viewtype来控制。
legend主要是用来说明图形的分类(可以说是图例)。
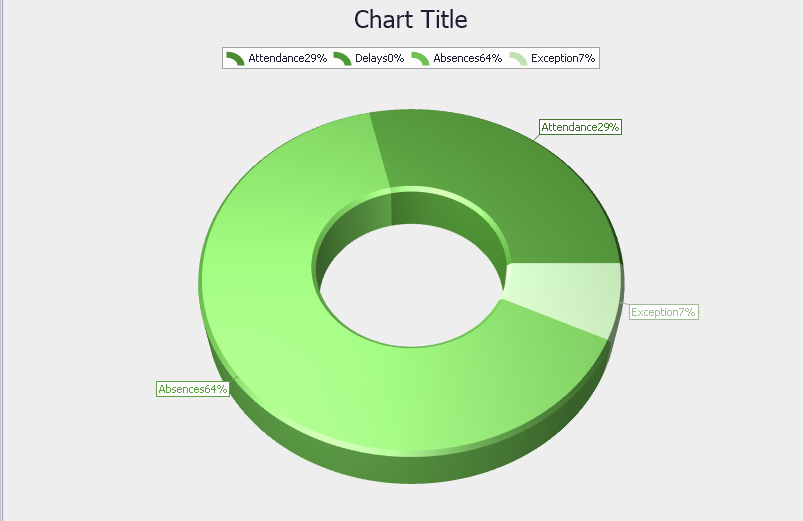
第一部分是以饼状图来分类显示各种情况所占的百分比:例如最近一段时间水果占销售总量的百分比是多少等等。
代码主要是先实例化chartcontrol,再对chartcontrol进行属性赋值最后进行绑定数据,代码如下:


 ChartControl staticsChart = new ChartControl();//create the chart control
        Series series1 = null;
        Series series2 = null;
        Series series3 = null;
        Series series4 = null;
/// <summary>
        /// config the format for doughnut3D
        /// </summary>
        private void AddDoughnut3D()
        {
            series1= new Series("Doughnut Sereis 1", ViewType.Doughnut3D);//add series1
            ChangeTheDouguntData();
            staticsChart.Series.Add(series1);
            series1.Label.TextPattern = "{A}{VP:0%}";
            ((Doughnut3DSeriesView)series1.View).HoleRadiusPercent=45;
            //((Doughnut3DSeriesView)series1.View).ExplodedPoints.Add(series1.Points[0]);export diagram
            ((SimpleDiagram3D)staticsChart.Diagram).RotationType = RotationType.UseAngles;
            ((SimpleDiagram3D)staticsChart.Diagram).RotationAngleX = -35;
            SetChartFormat();
        }
  private void SetChartFormat()
        {
            staticsChart.CrosshairOptions.ShowArgumentLabels = true;
            staticsChart.CrosshairOptions.ShowArgumentLine = true;
            staticsChart.CrosshairOptions.ShowCrosshairLabels = true;
            staticsChart.BackColor = Color.Transparent;
            staticsChart.PaletteBaseColorNumber = 1;
            staticsChart.PaletteName = "Green";
            staticsChart.Titles.Clear();
            ChartTitle chartTitle1 = new ChartTitle();
            staticsChart.Text = "Data Graphics";
            staticsChart.Titles.Add(chartTitle1);
            staticsChart.Legend.UseCheckBoxes = false;
            staticsChart.Legend.Direction = LegendDirection.LeftToRight;
            staticsChart.Legend.AlignmentHorizontal = LegendAlignmentHorizontal.Center;
            staticsChart.Dock = DockStyle.Fill;
            this.pnlAddDiagram.Controls.Add(staticsChart);
        }
 private void ChangeTheDouguntData()
        {
            DataTable diagramData = GetAllEmployeeDaySummary();
            int attendanceNumber = 0;
            int delaysNumber = 0;
            int absencesNumber = 0;
            int exceptionNumber = 0;
            if (diagramData.Rows.Count > 0)
            {
                attendanceNumber = diagramData.Select("pc_code=2" + " and pc_results>0").Length;
                delaysNumber = diagramData.Select("pc_code=6" + " and pc_results>0").Length;
                absencesNumber = diagramData.Select("pc_code=8" + " and pc_results>0").Length;
                exceptionNumber = diagramData.Select("pc_code in(11,12) " + " and pc_results>0").Length;
            }
            series1.Points.AddRange(new SeriesPoint[]{
            new SeriesPoint("Attendance",attendanceNumber),
            new SeriesPoint("Delays",delaysNumber),
            new SeriesPoint("Absences",absencesNumber),
            new SeriesPoint("Exception",exceptionNumber)});
        }
第二部分是柱状图,思路和饼状图差不多,series设置的不一样。

实现代码:
 1  private void AddBar3DChart()
 2         {
 3             series1 = new Series("Attendance", ViewType.Bar3D);
 4             series2 = new Series("Delays", ViewType.Bar3D);
 5             series3 = new Series("Absences", ViewType.Bar3D);
 6             series4 = new Series("Exception", ViewType.Bar3D);
 7             if (cmbType.SelectedIndex == 1)
 8             {
 9                 ChangeEmployeeBarData();
10             }
11             else if (cmbType.SelectedIndex == 2)
12             {
13                 ChangeDepartmentBarData();
14             }
15             staticsChart.Series.AddRange(new Series[] { series1, series2, series3, series4 });
16             //series1.Label.ResolveOverlappingMode = ResolveOverlappingMode.Default;
17
18             #region set the series view's value
19             Bar3DSeriesView myView1 = (Bar3DSeriesView)series1.View;
20             myView1.BarDepthAuto = false;
21             myView1.BarDepth = 0.2;
22             myView1.BarWidth = 0.5;
23             Bar3DSeriesView myView2 = (Bar3DSeriesView)series2.View;
24
25             myView2.BarDepthAuto = false;
26             myView2.BarDepth = 0.2;
27             myView2.BarWidth = 0.5;
28             Bar3DSeriesView myView3 = (Bar3DSeriesView)series3.View;
29             myView3.BarDepthAuto = false;
30             myView3.BarDepth = 0.2;
31             myView3.BarWidth = 0.5;
32             Bar3DSeriesView myView4 = (Bar3DSeriesView)series4.View;
33             myView4.BarDepthAuto = false;
34             myView4.BarDepth = 0.2;
35             myView4.BarWidth = 0.5;
36             #endregion
37
38             XYDiagram3D myDiagram = (XYDiagram3D)staticsChart.Diagram;
39             myDiagram.RotationType = RotationType.UseAngles;
40             myDiagram.RotationOrder = RotationOrder.XYZ;
41             myDiagram.RotationAngleX = 0;
42             myDiagram.RotationAngleY = 0;
43             myDiagram.RotationAngleZ = 270;
44             myDiagram.RuntimeScrolling = true;
45             SetChartFormat();
46         }
47
48
49 private void ChangeDepartmentBarData()
50         {
51             List<Employee> empList = treeModule.CheckedEmps;
52             List<Department> depList = treeModule.CheckedDepartment;
53             DateTime fromDate = dteFromDate.DateTime;
54             DateTime endDate = dteEndDate.DateTime;
55             List<DaySummary> dsList = new DaySummaryBLL().GetEmployeesDailySummary(empList, fromDate, endDate);
56             List<Paycode> paycodeList = new PaycodeBLL().GetMainFields();
57             var dsPaycodeList = from ds in dsList
58                                 join p in paycodeList on ds.paycode.id equals p.id
59                                 where ds.pc_results > 0
60                                 orderby ds.employee.id ascending, ds.att_date descending
61                                 select new { ID = ds.employee.id, Minutes = ds.pc_results, Date = ds.att_date, Paycode = p.pc_code };
62             foreach (Department dep in depList)
63             {
64                 int attendanceDay = 0;
65                 int delaysDay = 0;
66                 int absencesDay = 0;
67                 int ExceptionDay = 0;
68                 List<Employee> depEmpList = new EmployeeBLL().GetMainFields(string.Format("where e.department.id={0}", dep.id));
69                 foreach (Employee employee in depEmpList)
70                 {
71                     attendanceDay += dsPaycodeList.Count(dspaycode => dspaycode.ID == employee.id && dspaycode.Paycode == 2);
72                     delaysDay += dsPaycodeList.Count(dspaycode => dspaycode.ID == employee.id && dspaycode.Paycode == 6);
73                     absencesDay += dsPaycodeList.Count(dspaycode => dspaycode.ID == employee.id && dspaycode.Paycode == 8);
74                     ExceptionDay += dsPaycodeList.Count(dspaycode => dspaycode.ID == employee.id && dspaycode.Paycode == 11) +
75                         dsPaycodeList.Count(dspaycode => dspaycode.ID == employee.id && dspaycode.Paycode == 12);
76                 }
77                 series1.Points.Add(new SeriesPoint(dep.dept_name.ToString(), attendanceDay));
78                 series2.Points.Add(new SeriesPoint(dep.dept_name.ToString(), delaysDay));
79                 series3.Points.Add(new SeriesPoint(dep.dept_name.ToString(), absencesDay));
80                 series4.Points.Add(new SeriesPoint(dep.dept_name.ToString(), ExceptionDay));
81             }
82         }
以上主要是提供一个思路怎么来解决这种图形统计类问题,以及怎么进行数据绑定,如有不对的地方请指出。