利用DenseUNet深度神经网络数之联河湖遥感大数据的研究

        遥感能低成本地解决全局监测问题。基于高分二号卫星遥感数据,数之联为智慧治理中心构建了成都市河湖遥感大数据分析体系。其核心机理是洁净、黑臭、绿藻和高泥沙含量的水体,会因其中悬浮物、叶绿素-a、泥沙等物质的含量不同而呈现不同的光谱特征。我们利用人工智能技术自动解译遥感图像,准确再现污染水体的分布,实现成都水体污染情况的整体感知。同时通过融合物联网数据与网络理政数据,从宏观到微观,全方位掌握河湖量分布,水质污染情况及污染演变趋势。

  (1)技术路线

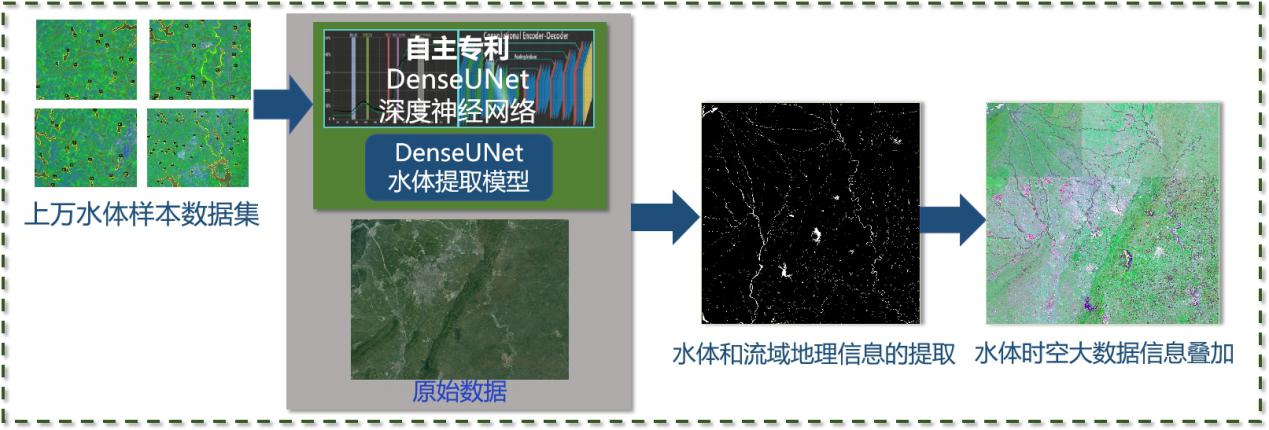
  首先,将多张遥感图分别切成36000个网格,分析各网格云层覆盖率,并以覆盖率最低的网格为基底融合成完整无云影像,消除云层影响。

  然后,利用DenseUNet深度神经网络对上万个水体样本数据集进行学习,得到水体提取模型,将原始遥感数据输入水体提取模型中,能够快速准确的对水体进行大规模自动提取,并根据提取结果计算区域水网密度指数。

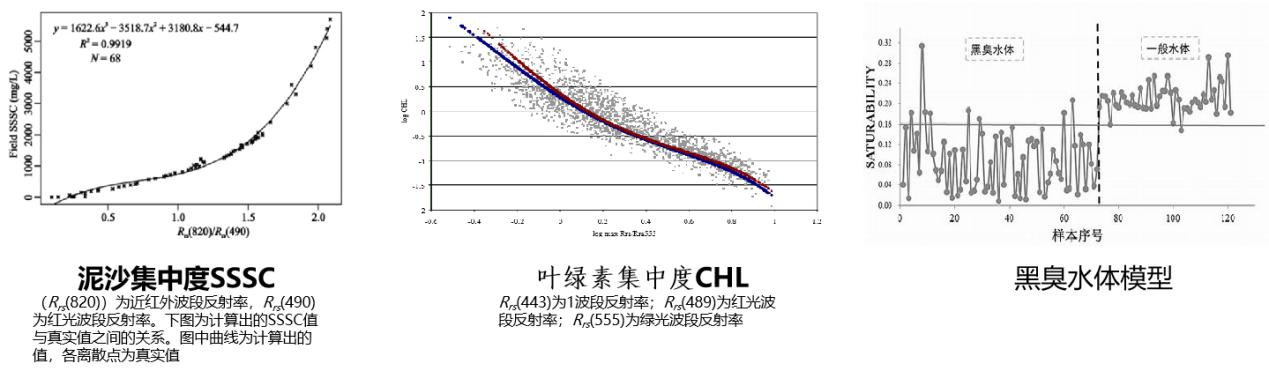
  最后,通过分析水中不同污染成分对光谱响应的差异性,构建指标反演模型,计算水体中叶绿素a、有色可溶解有机物(CDOM)、悬浮沉积物(SSSC)等物质含量,识别水体污染类型(黑河污染、水体富营养污染、泥沙污染),评估不同种类污染程度,建立水质综合感官指数。

  (2)数字成效

  河湖资源监测方面,目前系统已识别了1200余处水资源对象,总面积约为340km²。水污染监测方面,与全国城市黑臭水体整治信息平台公示的41处黑臭河渠治理名单相比,我们发现其中有37处明显改善。此外还发现了其他黑臭水体3处,需要进一步关注的高泥沙含量水体4处。

  (3)应用方向

  在未来,随着遥感和其他相关数据的不断积累,我们还将进一步探索水体违规侵占识别、水体面积演变趋势等内容,并形成可全国推广的示范性应用。


<!DOCTYPE html>
<html>
<head>
<meta charset="UTF-8">
<title data-i18n="resources.title_summaryAttributesJobService"></title>
<style>
        .control {
            position: absolute;
            top: 50px;
            right: 10px;
        }

        #map {
            position: absolute;
        }

        .echarts {
            position: absolute;
            top: 30px;
            left: 10px;
             400px;
            height: 300px;
        }
    </style>
</head>
<body style=" margin: 0;overflow: hidden;background: #fff; 100%;height:100%;position: absolute;top: 0;">
<div id="map" style=" 100%;height: 100%"></div>
<div id="control" class="control" style='350px'>
<div class="panel panel-default">
<div class="panel-heading">
<h3 class="panel-title" data-i18n="resources.title_summaryAttributesJobService"></h3>
</div>
<div class="panel-body">
<div class="input-group">
<span class="input-group-addon"><span data-i18n="resources.text_inputData"></span><span data-i18n="[title]resources.text_requiredField" style="color: red;"> * </span> </span>
<input id="datasetName" type="text" class="form-control" value="samples_processing_newyorkZone_R" />
</div>
<p></p>
<div class='input-group'>
<span class='input-group-addon' data-i18n="resources.text_groupField"></span>
<input id='groupField' type='text' class='form-control' value='borough' />
</div>
<p></p>
<div class='input-group'>
<span class='input-group-addon' data-i18n="resources.text_attributeField"></span>
<input id='attributeField' type='text' class='form-control' value='LocationID' />
</div>
<p></p>
<div class='input-group'>
<span class='input-group-addon' data-i18n="resources.text_statisticModes"></span>
<input id='statisticModes' type='text' class='form-control' value='sum' />
</div>
<p></p>
<div align="right">
<input type="button" id='btn' class="btn btn-primary" data-i18n="[value]resources.btn_summary" />
</div>
</div>
</div>
</div>
<div id="echarts" class="echarts"></div>
<script type="text/javascript" include="jquery,bootstrap,widgets" src="../js/include-web.js"></script>
<script type="text/javascript" include="echarts" src="../../dist/classic/include-classic.js"></script>
<script type="text/javascript">
        var host = window.isLocal ? window.server : "https://iserver.supermap.io";
        var chartLayer,
            processingsUrl = host + "/iserver/services/distributedanalyst/rest/v1/jobs",
            mapURL = host + "/iserver/services/map-world/rest/maps/World",
            map = new SuperMap.Map("map", {
                controls: [
                    new SuperMap.Control.Navigation(),
                    new SuperMap.Control.Zoom(),
                    new SuperMap.Control.LayerSwitcher()

                ],
                allOverlays: true
            });
        map.addControl(new SuperMap.Control.MousePosition());
        var layer = new SuperMap.Layer.TiledDynamicRESTLayer("World", mapURL, null, {
            maxResolution: "auto"
        });
        layer.events.on({
            "layerInitialized": addLayer
        });

        function addLayer() {
            map.addLayers([layer]);
            map.setCenter(new SuperMap.LonLat(-73.95, 40.75), 12);
        }

        var processingService = new SuperMap.REST.ProcessingService(processingsUrl, {
            withCredentials: window.isLocal
        });
        SuperMap.SecurityManager.registerToken(processingsUrl, window.exampleToken);

        $('#btn').on('click', function () {
            if ($('#msg_container')[0]) {
                $('#msg_container').remove();
            }
            widgets.loader.showLoader();
            $("#echarts").html("");
            $("#echarts").hide();
            var summaryAttributesJobsParameter = new SuperMap.SummaryAttributesJobsParameter({
                datasetName: $('#datasetName').val(),
                groupField: $('#groupField').val(),
                attributeField: $('#attributeField').val(),
                statisticModes: $('#statisticModes').val()
            });
            processingService.addSummaryAttributesJob(summaryAttributesJobsParameter, function (serviceResult) {
                if (serviceResult.error) {
                    widgets.loader.removeLoader();
                    var errorMsg = serviceResult.error.errorMsg || "code: " + serviceResult.error;
                    widgets.alert.showAlert(resources.msg_createFailed + "<br>" + errorMsg, false);
                    return;
                }
                serviceResult.result.setting.serviceInfo.targetServiceInfos.map(function (info) {
                    if (info.serviceType === 'RESTDATA') {
                        var dataUrl = info.serviceAddress + '/data';
                        var getFeatureParam, getFeatureBySQLService, getFeatureBySQLParams;

                        getFeatureParam = new SuperMap.REST.FilterParameter({
                            name: "analystResult@UntitledDatasource",
                            attributeFilter: "SMID > 0"
                        });
                        getFeatureBySQLParams = new SuperMap.REST.GetFeaturesBySQLParameters({
                            queryParameter: getFeatureParam,
                            datasetNames: ["UntitledDatasource:analystResult"]
                        });
                        getFeatureBySQLService = new SuperMap.REST.GetFeaturesBySQLService(
                            dataUrl, {
                                eventListeners: {
                                    "processCompleted": function (getFeaturesEventArgs) {
                                        result = getFeaturesEventArgs.result.features;
                                        var names = [];
                                        var data1 = [];
                                        var data2 = [];
                                        for (var i = 0; i < result.length; i++) {
                                            names.push(result[i].attributes.BOROUGH);
                                            data1.push(parseFloat(result[i].attributes.RECORDCOUNT));
                                            data2.push(parseFloat(result[i].attributes.SUM_LOCATIONID));
                                        }
                                        $("#echarts").show();
                                        var ChartDom = document.createElement("div");
                                        ChartDom.id = "piechart";
                                        ChartDom.style.width = "400px";
                                        ChartDom.style.height = "300px";
                                        ChartDom.style.left = "10px";
                                        ChartDom.style.top = "80px";
                                        ChartDom.style.position = "absolute";
                                        $("#echarts").append(ChartDom);
                                        var chart = echarts.init(ChartDom);
                                        option = {
                                            backgroundColor: '#0E2A43',
                                            legend: {
                                                bottom: 20,
                                                textStyle: {
                                                    color: '#fff',
                                                },
                                                data: ['RECORDCOUNT',
                                                    'SUM_LOCATIONID'
                                                ]
                                            },
                                            grid: {
                                                left: '3%',
                                                right: '4%',
                                                bottom: '20%',
                                                containLabel: true
                                            },
                                            tooltip: {
                                                show: "true",
                                                trigger: 'axis',
                                                axisPointer: { // 坐标轴指示器,坐标轴触发有效
                                                    type: 'shadow' // 默认为直线,可选为:'line' | 'shadow'
                                                }
                                            },
                                            xAxis: {
                                                type: 'value',
                                                axisTick: {
                                                    show: false
                                                },
                                                axisLine: {
                                                    show: false,
                                                    lineStyle: {
                                                        color: '#fff',
                                                    }
                                                },
                                                splitLine: {
                                                    show: false
                                                },
                                            },
                                            yAxis: [{
                                                    type: 'category',
                                                    data: names,
                                                    axisTick: {
                                                        show: false
                                                    },
                                                    axisLine: {
                                                        show: true,
                                                        lineStyle: {
                                                            color: '#fff',
                                                        }
                                                    }
                                                },
                                                {
                                                    type: 'category',
                                                    data: names,
                                                    axisLine: {
                                                        show: false
                                                    },
                                                    axisTick: {
                                                        show: false
                                                    },
                                                    axisLabel: {
                                                        show: false
                                                    },
                                                    splitArea: {
                                                        show: false
                                                    },
                                                    splitLine: {
                                                        show: false
                                                    }
                                                }
                                            ],
                                            series: [{
                                                    name: 'RECORDCOUNT',
                                                    type: 'bar',
                                                    itemStyle: {
                                                        normal: {
                                                            show: true,
                                                            color: '#5de3e1',
                                                            barBorderRadius: 50,
                                                            borderWidth: 0,
                                                            borderColor: '#333',
                                                        }
                                                    },
                                                    data: data1,
                                                    barGap: '0%',
                                                    barCategoryGap: '50%'
                                                },
                                                {
                                                    name: 'SUM_LOCATIONID',
                                                    type: 'bar',
                                                    yAxisIndex: 1,
                                                    itemStyle: {
                                                        normal: {
                                                            show: true,
                                                            color: '#277ace',
                                                            barBorderRadius: 50,
                                                            borderWidth: 0,
                                                            borderColor: '#333',
                                                        }
                                                    },
                                                    data: data2,
                                                    barGap: '0%',
                                                    barCategoryGap: '50%'
                                                }
                                            ]
                                        };
                                        chart.setOption(option);
                                        widgets.loader.removeLoader();
                                    },
                                    "processFailed": function (e) {
                                        widgets.alert.showAlert(e.error.errorMsg, false);
                                    }
                                }
                            });
                        getFeatureBySQLService.processAsync(getFeatureBySQLParams);
                    }
                });
            });
        });
    </script>
</body>
</html>


技术交流 省涯 QQ:2252224326 2252224326@qq.com 版权所有 http://blog.sina.com.cn/u/6029512413
原文地址:https://www.cnblogs.com/shengya/p/14957484.html