本期介绍基于地理信息平台的国土空间规划平台的规划辅助编制应用。在梳理国土空间规划科学流程的基础上,将规划编制各关键环节信息化、工具化、智能化;充分发挥清华同衡大数据与智能模型相结合的定量评估、精准预测的数据优势与模型优势,提升国土空间规划编制的精准性、科学性。
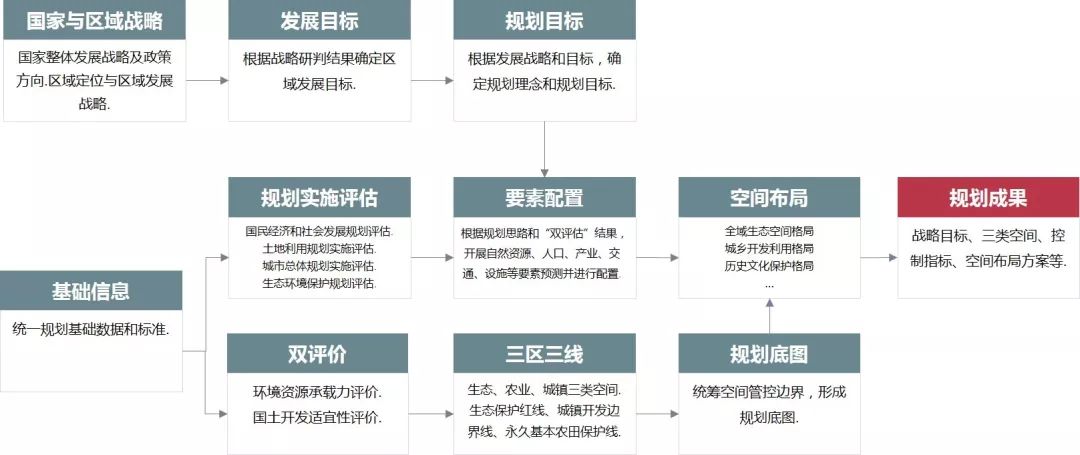
国土空间规划编制包括明晰规划思路、统一规划基础、开展基础评价、绘制规划底图、编制空间规划等主要任务。在统一规划基础信息前提下,开展资源环境承载能力评价和国土空间开发适宜性评价,划定“三区三线”,形成规划底图;结合国家、区域及城市发展战略,制定规划目标,在规划实施评估的基础上,进行要素配置,并叠加规划底图,形成空间布局方案,完成规划成果编制。规划辅助编制应用针对以上各任务,提供智能化的分析模块。
![]()
国土空间规划编制流程
|
模块1 |
规划基础信息数据处理 |
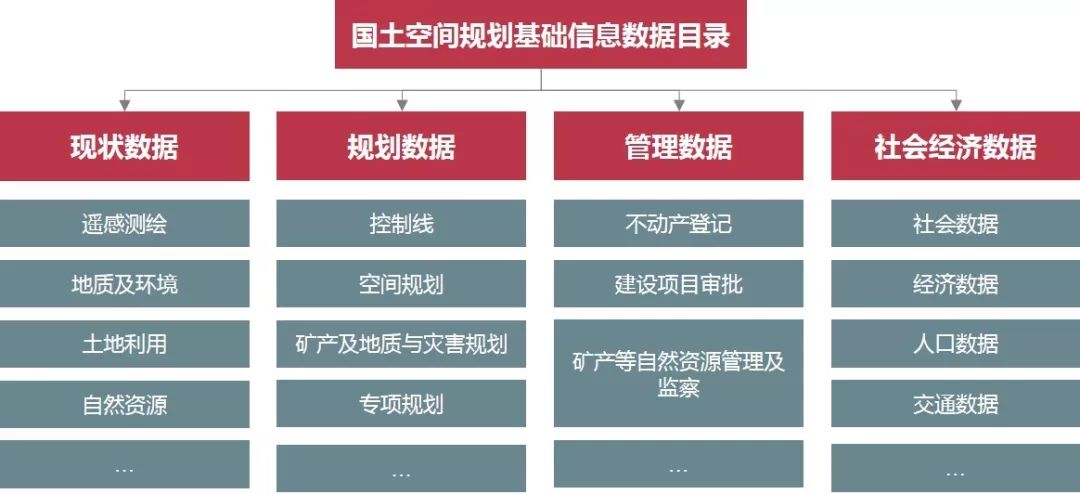
国土空间规划编制需要统一的规划基础信息数据支撑。但目前规划基础信息数据种类多样、来源不一,面临基准坐标、数据格式、时空精度不统一等问题。规划基础信息数据处理模块,建立国土空间规划数据存储、数据治理与数据使用规则;支持图表、文本、空间矢量、栅格、海量高时空精度社会大数据等各类型数据的存储、加载与展示;提供坐标转换、格式转换、时空精度转换等功能,为国土空间规划提供统一的规划基础信息数据。
![]()
国土空间规划基础信息数据目录
|
模块2 |
“双评价” |
资源环境承载能力评价和国土空间开发适宜性评价(简称“双评价”)是开展国土空间规划编制的前提和基础。
其中,资源环境承载能力评价是指在土地资源、水资源、海洋资源、环境、生态、灾害等单项资源环境要素评价的基础上,开展生态功能、农业功能、城镇功能导向的资源环境承载能力集成评价。
国土空间开发适宜性评价以资源环境承载能力评价结果为基础,划定生态保护、农业生产、城镇建设适宜性分区。结合“双评价”结果,进行资源环境秉赋特征、问题与风险识别、潜力分析、情景分析等综合分析。
“双评价”模块以《资源环境承载能力和国土空间开发适宜性评价技术指南》为依据,为每项资源环境要素单项评价、集成评价提供数据处理、要素分级、阈值率定、优化修正、空间分析、统计图表等功能,实现智能化的评价分析、成果核验和输出。

![]()
“双评价”流程
![]()
![]() “双评价”模块界面
“双评价”模块界面
|
模块3 |
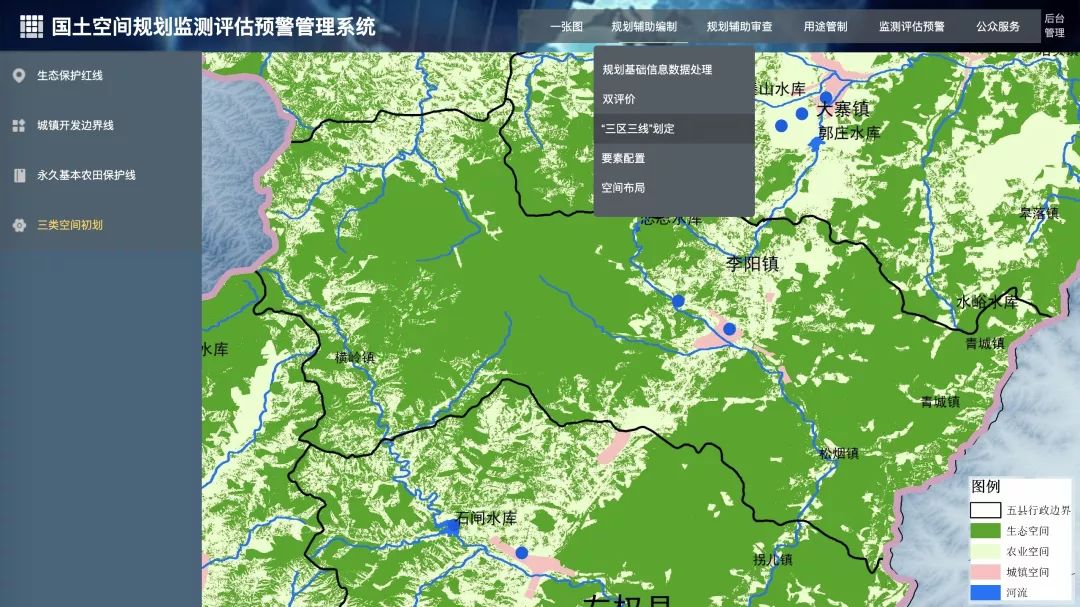
“三区三线”划定 |
“三区三线”作为空间规划底图的载体,是指在“双评价”的基础上,科学有序统筹布局生态、农业、城镇等功能空间,划定生态保护红线、永久基本农田、城镇开发边界等空间管控边界。
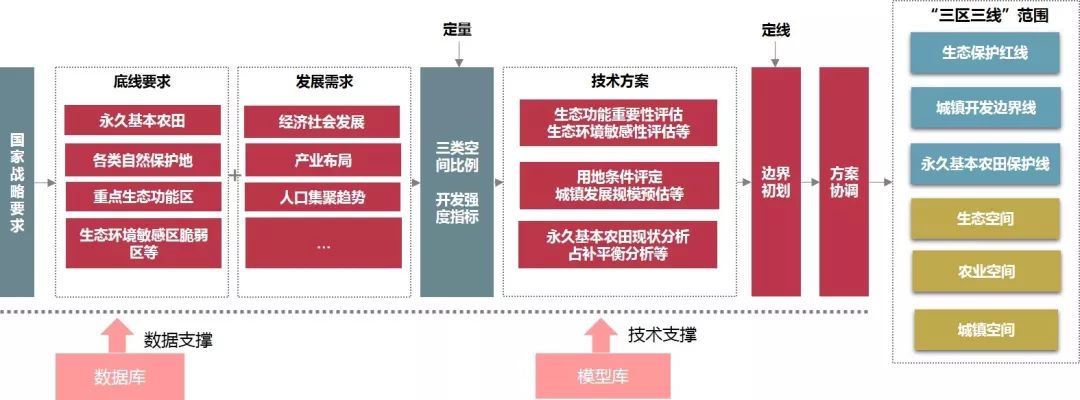
“三区三线”划定模块在综合考虑底线保护要求(永久基本农田、各类自然保护地、重点生态功能区、生态环境敏感区和脆弱区保护等)和社会经济发展要素(经济社会发展、产业布局、人口集聚趋势等)基础上,科学测算城镇、农业、生态三类空间比例和开发强度指标。
参照生态红线、城镇开发边界等划定指南,梳理生态保护要素,开展生态功能重要性评价、生态敏感性评价,划定生态保护红线;基于城镇发展现状研究、城镇发展定位和目标分析、城镇发展规模预测、城镇空间格局研究等,划定城镇开发边界;通过永久基本农田现状分析、占补平衡分析等,划定永久基本农田保护线。统筹“双评价”结果、三条控制线位置,初步划定生态、农业、城镇适宜空间。
“三区三线”划定模块提供边界初划的基本流程及分析工具,以及冲突检测、方案协调等功能,实现“三区三线”智能划定、成果检验和输出。
![]()
“三区三线”划定流程
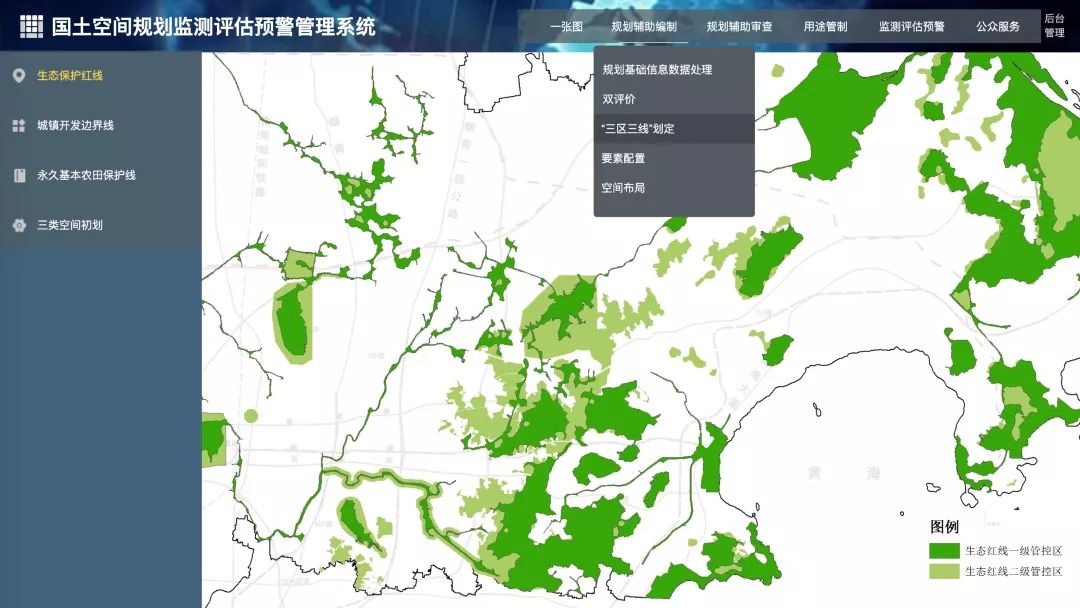
![]()
![]()
“三区三线”划定模块界面
|
模块4 |
要素配置及空间布局 |
围绕底线约束、绿色发展、城乡融合、区域协同、以人为本、品质提升等发展要求,重点解决要素配置问题。通过高时空精度大数据和灵活的专业模型,进行自然资源、生态环境、人口、产业、交通、基础设施等要素现状评估与发展预测模拟,为各类要素定类别、定规模、定位置、定关系,提供科学量化支撑。