0、import
import string
import numpy as np
import matplotlib as mpl
import matplotlib.pyplot as plt
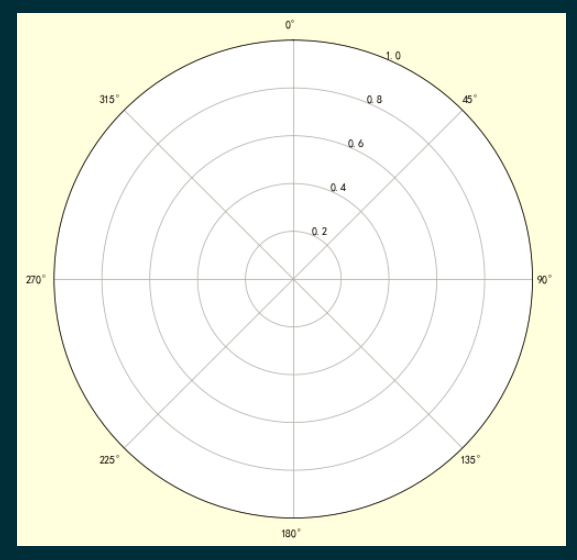
1、极坐标系
# 设置画布
fig = plt.figure(figsize=(12, 8),    # 画布尺寸
                 facecolor='lightyellow'    # 画布背景色
                )

# 设置极坐标系
ax = plt.axes(polar=True)   # 实例化极坐标系
ax.set_theta_direction(-1)  # 顺时针为极坐标正方向
ax.set_theta_zero_location('N')     # 极坐标 0° 方向为 N
效果:
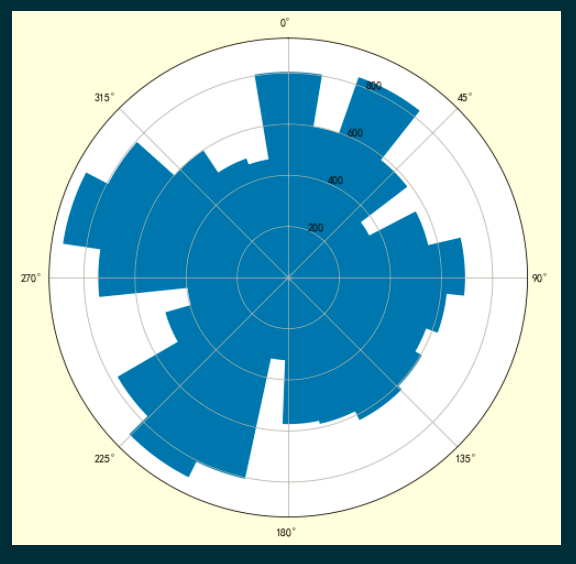
2、添加数据绘制极条图
data = [805, 598, 831, 586, 357, 562, 692, 623, 575, 605, 623, 585, 573,
            323, 805, 873, 773, 500, 396, 744, 892, 795, 598, 494, 469, 373]

theta = np.linspace(0, 2*np.pi, len(data))    # 等分极坐标系

# 设置画布
fig = plt.figure(figsize=(12, 8),    # 画布尺寸
                 facecolor='lightyellow'    # 画布背景色
                )

# 设置极坐标系
ax = plt.axes(polar=True)   # 实例化极坐标系
ax.set_theta_direction(-1)  # 顺时针为极坐标正方向
ax.set_theta_zero_location('N')     # 极坐标 0° 方向为 N


# 在极坐标系中画柱形图
ax.bar(x=theta,    # 柱体的角度坐标
       height=data,    # 柱体的高度, 半径坐标
       width=0.33,    # 柱体的宽度
      );
效果:
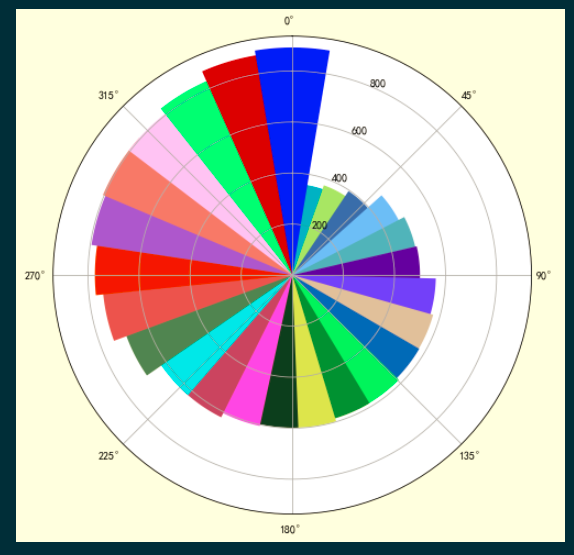
3、对数据排序、添加颜色映射生成南丁格玫瑰图
data = [805, 598, 831, 586, 357, 562, 692, 623, 575, 605, 623, 585, 573,
            323, 805, 873, 773, 500, 396, 744, 892, 795, 598, 494, 469, 373]
data.sort()

theta = np.linspace(0, 2*np.pi, len(data))    # 等分极坐标系

# 设置画布
fig = plt.figure(figsize=(12, 8),    # 画布尺寸
                 facecolor='lightyellow'    # 画布背景色
                )

# 设置极坐标系
ax = plt.axes(polar=True)   # 实例化极坐标系
ax.set_theta_direction(-1)  # 顺时针为极坐标正方向
ax.set_theta_zero_location('N')     # 极坐标 0° 方向为 N


# 在极坐标系中画柱形图
ax.bar(x=theta,    # 柱体的角度坐标
       height=data,    # 柱体的高度, 半径坐标
       width=0.33,    # 柱体的宽度
       color=np.random.random((len(data),3))
      );
图形效果:
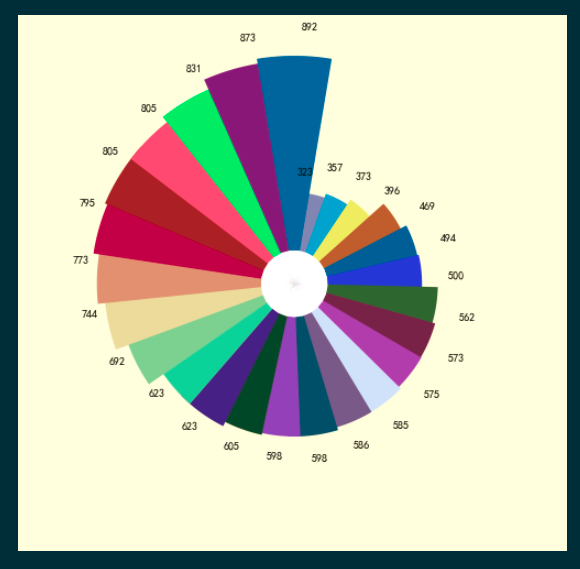
4、挖空中心、添加数据标注、关闭坐标轴和网格完成南丁格玫瑰图
data = [805, 598, 831, 586, 357, 562, 692, 623, 575, 605, 623, 585, 573,
            323, 805, 873, 773, 500, 396, 744, 892, 795, 598, 494, 469, 373]
data.sort()

theta = np.linspace(0, 2*np.pi, len(data))    # 等分极坐标系

# 设置画布
fig = plt.figure(figsize=(12, 8),    # 画布尺寸
                 facecolor='lightyellow'    # 画布背景色
                )

# 设置极坐标系
ax = plt.axes(polar=True)   # 实例化极坐标系
ax.set_theta_direction(-1)  # 顺时针为极坐标正方向
ax.set_theta_zero_location('N')     # 极坐标 0° 方向为 N


# 在极坐标系中画柱形图
ax.bar(x=theta,    # 柱体的角度坐标
       height=data,    # 柱体的高度, 半径坐标
       width=0.33,    # 柱体的宽度
       color=np.random.random((len(data_list),3))
      )
## 绘制中心空白
ax.bar(x=theta,    # 柱体的角度坐标
       height=130,    # 柱体的高度, 半径坐标
       width=0.33,    # 柱体的宽度
       color='white'
      )
# 添加数据标注
for angle, data, lab in zip(theta, data_list, labs):
    ax.text(angle+0.03, data+100, str(data) )

ax.set_axis_off();
图形效果: