for multi-waveforms with different colors:

R-Xmin/-Xmax/Ymin/Ymax
-Ba/b, a: x delta; b:y delta
-MYmax-Ymin for normalize y values
*.z X Y
plot x position and y position
result:
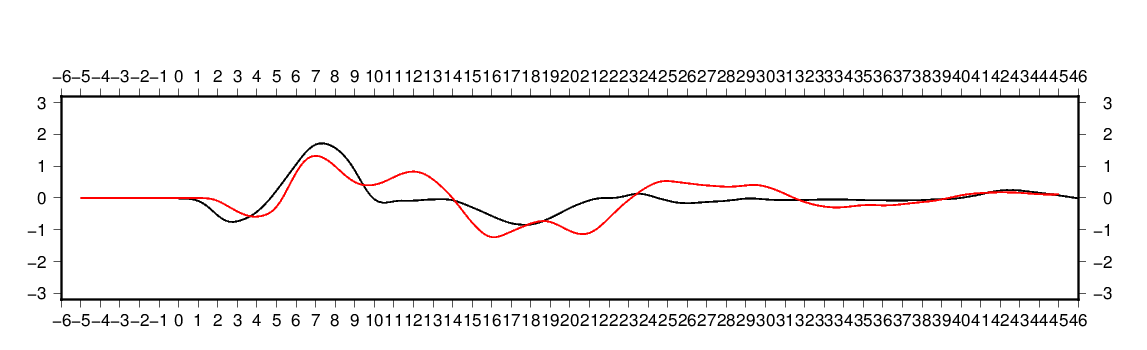
for multi-waveforms with different colors:
R-Xmin/-Xmax/Ymin/Ymax
-Ba/b, a: x delta; b:y delta
-MYmax-Ymin for normalize y values
*.z X Y
plot x position and y position
result: