慢SQL监控默认都是关的
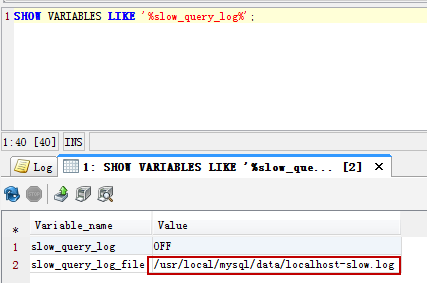
SHOW VARIABLES LIKE '%slow%';SHOW VARIABLES LIKE '%slow_query_log%';查看慢SQL日志位置
show variables like '%slow_query_log_file%'
设置日志路径
set global slow_query_log_file='/usr/local/mysql/data/localhost-slow.log'
开启慢查询功能
SET GLOBAL slow_query_log=1;关闭慢查询功能
SETGLOBAL slow_query_log=0; long_query_time表示超过多少秒的查询就写入日志,默认10秒,设置为0表示记录所有的查询SHOW VARIABLES LIKE 'long_query_time%';long_query_time参数修改完成后需要重新打开一个窗口进行查询才能看到效果
SET GLOBAL long_query_time=3;
记录所有的查询
SET GLOBAL long_query_time=0;
使用语句测试;SELECT sleep(11);
慢SQL日志文件:/usr/sbin/mysqld, Version: 5.6.15-enterprise-commercial-advanced (MySQL Enterprise Server - Advanced Edition (Commercial)). started with:Tcp port: 3306 Unix socket: /var/lib/mysql/mysql.sockTime Id Command Argument# Time: 201118 16:17:16# User@Host: root[root] @ [10.12.0.46] Id: 11942# Query_time: 11.000337 Lock_time: 0.000000 Rows_sent: 1 Rows_examined: 0use wanghb005;SET timestamp=1605687436;SELECT sleep(11);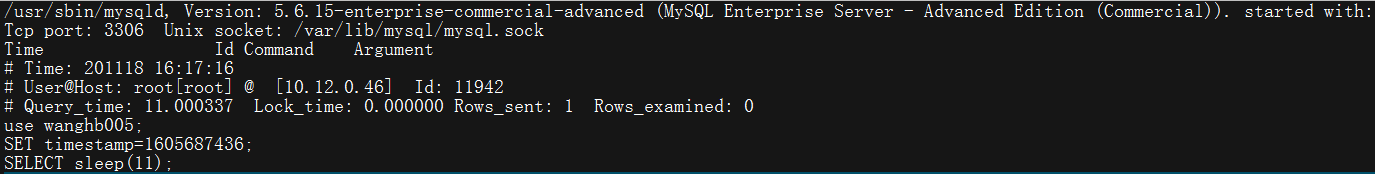
当前连接数统计:select count(*) from information_schema.PROCESSLIST 查看mysql连接数:show full processlist; 若不加上full选项,则最多显示100条记录。
若以root帐号登录,你能看到所有用户的当前连接。如果是其它普通帐号,只能看到自己占用的连接。
在调试程序时,如怀疑应用程序中存在申请DB连接未释放的情况,可以通过该命令查询连接数(以应用程序中的user登录)。如程序运行过程中连接数越来越多,则可以判断程序中有DB资源未释放。
当前连接数:show status like 'Threads%'; 最大连接数查看,mysql默认最大连接数600:show variables like '%max_connections%';最大连接数修改:
set global max_connections=1000
查看mysql版本号:select version()
Show Profile分析
Show Profile也是分析慢SQL的一种手段,但它能获得比explain更详细的信息,能分析当前会话中语句执行的资源消耗情况,能获得这条SQL在整个生命周期的耗时,相当于执行时间的清单,也很重要。 默认关闭。开启后,会在后台保存最近15次的运行结果,然后通过Show Profile命令查看结果。
set profiling = on;
show variables like 'profiling%'
set profiling_history_size = 20
通过Show Profile能查看SQL的耗时
show profiles;

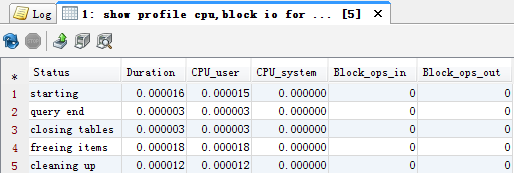
通过Query_ID可以得到具体SQL从连接 - 服务 - 引擎 - 存储四层结构完整生命周期的耗时
show profile cpu,block io for query 50;
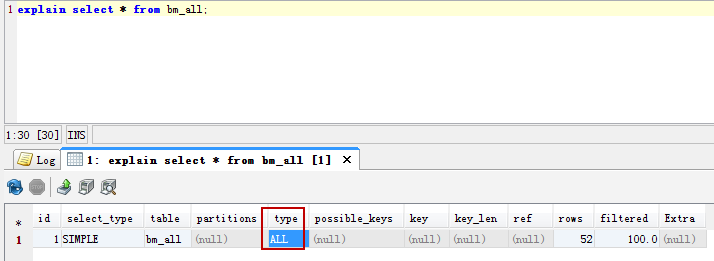
explain SQL语句,例:explain select * from bm_all; type=ALL代表全表扫描