locust官网: https://www.locust.io/
locust 的官方 Github 是:https://github.com/locustio/locust
官网帮助文档: https://docs.locust.io/en/latest/installation.html

Locust 是一个比较容易上手的分布式用户负载测试工具。
它旨在对网站(或其他系统)进行负载测试,并确定系统可以处理多少个并发用户,Jmeter 也可以处理这种场景,但是个人感觉 Jmeter 在这方面做的不如 Locust 专业。
Locust 在英文中是 蝗虫 的意思:
作者的想法是,在测试期间,放一大群 蝗虫 攻击您的网站。
当然事先是可以用 Locust 定义每个蝗虫(或测试用户)的行为,并且通过 Web UI 实时监视围攻过程。
这将帮助您在项目上线之前测试并确定项目的瓶颈;
Locust 的运行原理
Locust 的运行原理是完全基于事件运行的,因此可以在一台计算机上支持数千个并发用户。
与许多其他基于事件的应用程序相比,它不使用回调(比如 Nodejs 就是属于回调,Locust 不使用这种的逻辑)。
相反,它通过 gevent 使用轻量级进程。测试您站点的每个蝗虫实际上都在其自己的进程中运行(正确地说,是Greenlet)。
这可以让您写 Python 代码的时候更加简单,而不会进入类似 JS 的那种回调地域。
大并发量测试时,建议在linux系统下进行。
安装locust
pip install locust
显示帮助信息
locust --help
test.py
from locust import HttpUser, task, between

class QuickstartUser(HttpUser):
    wait_time = between(1, 2)

    def on_start(self):
        self.client.post("/")

    @task
    def hello_world(self):
        self.client.get("/hello")
        self.client.get("/world")

    @task(3)
    def view_item(self):
        for item_id in range(10):
            self.client.get(f"/item?id={item_id}", name="/item")
运行
macname@MacdeMacBook-Pro Desktop % locust -f test.py
[2020-12-18 09:54:01,085] MacdeMacBook-Pro.local/INFO/locust.main: Starting web interface at http://0.0.0.0:8089 (accepting connections from all network interfaces)
[2020-12-18 09:54:01,093] MacdeMacBook-Pro.local/INFO/locust.main: Starting Locust 1.4.1
[2020-12-18 09:54:22,711] MacdeMacBook-Pro.local/INFO/locust.runners: Spawning 30 users at the rate 2 users/s (0 users already running)...
[2020-12-18 09:54:35,265] MacdeMacBook-Pro.local/INFO/locust.runners: Stopping 26 users
[2020-12-18 09:54:35,268] MacdeMacBook-Pro.local/INFO/locust.runners: 26 Users have been stopped, 0 still running
打开本地网页
http://localhost:8089/
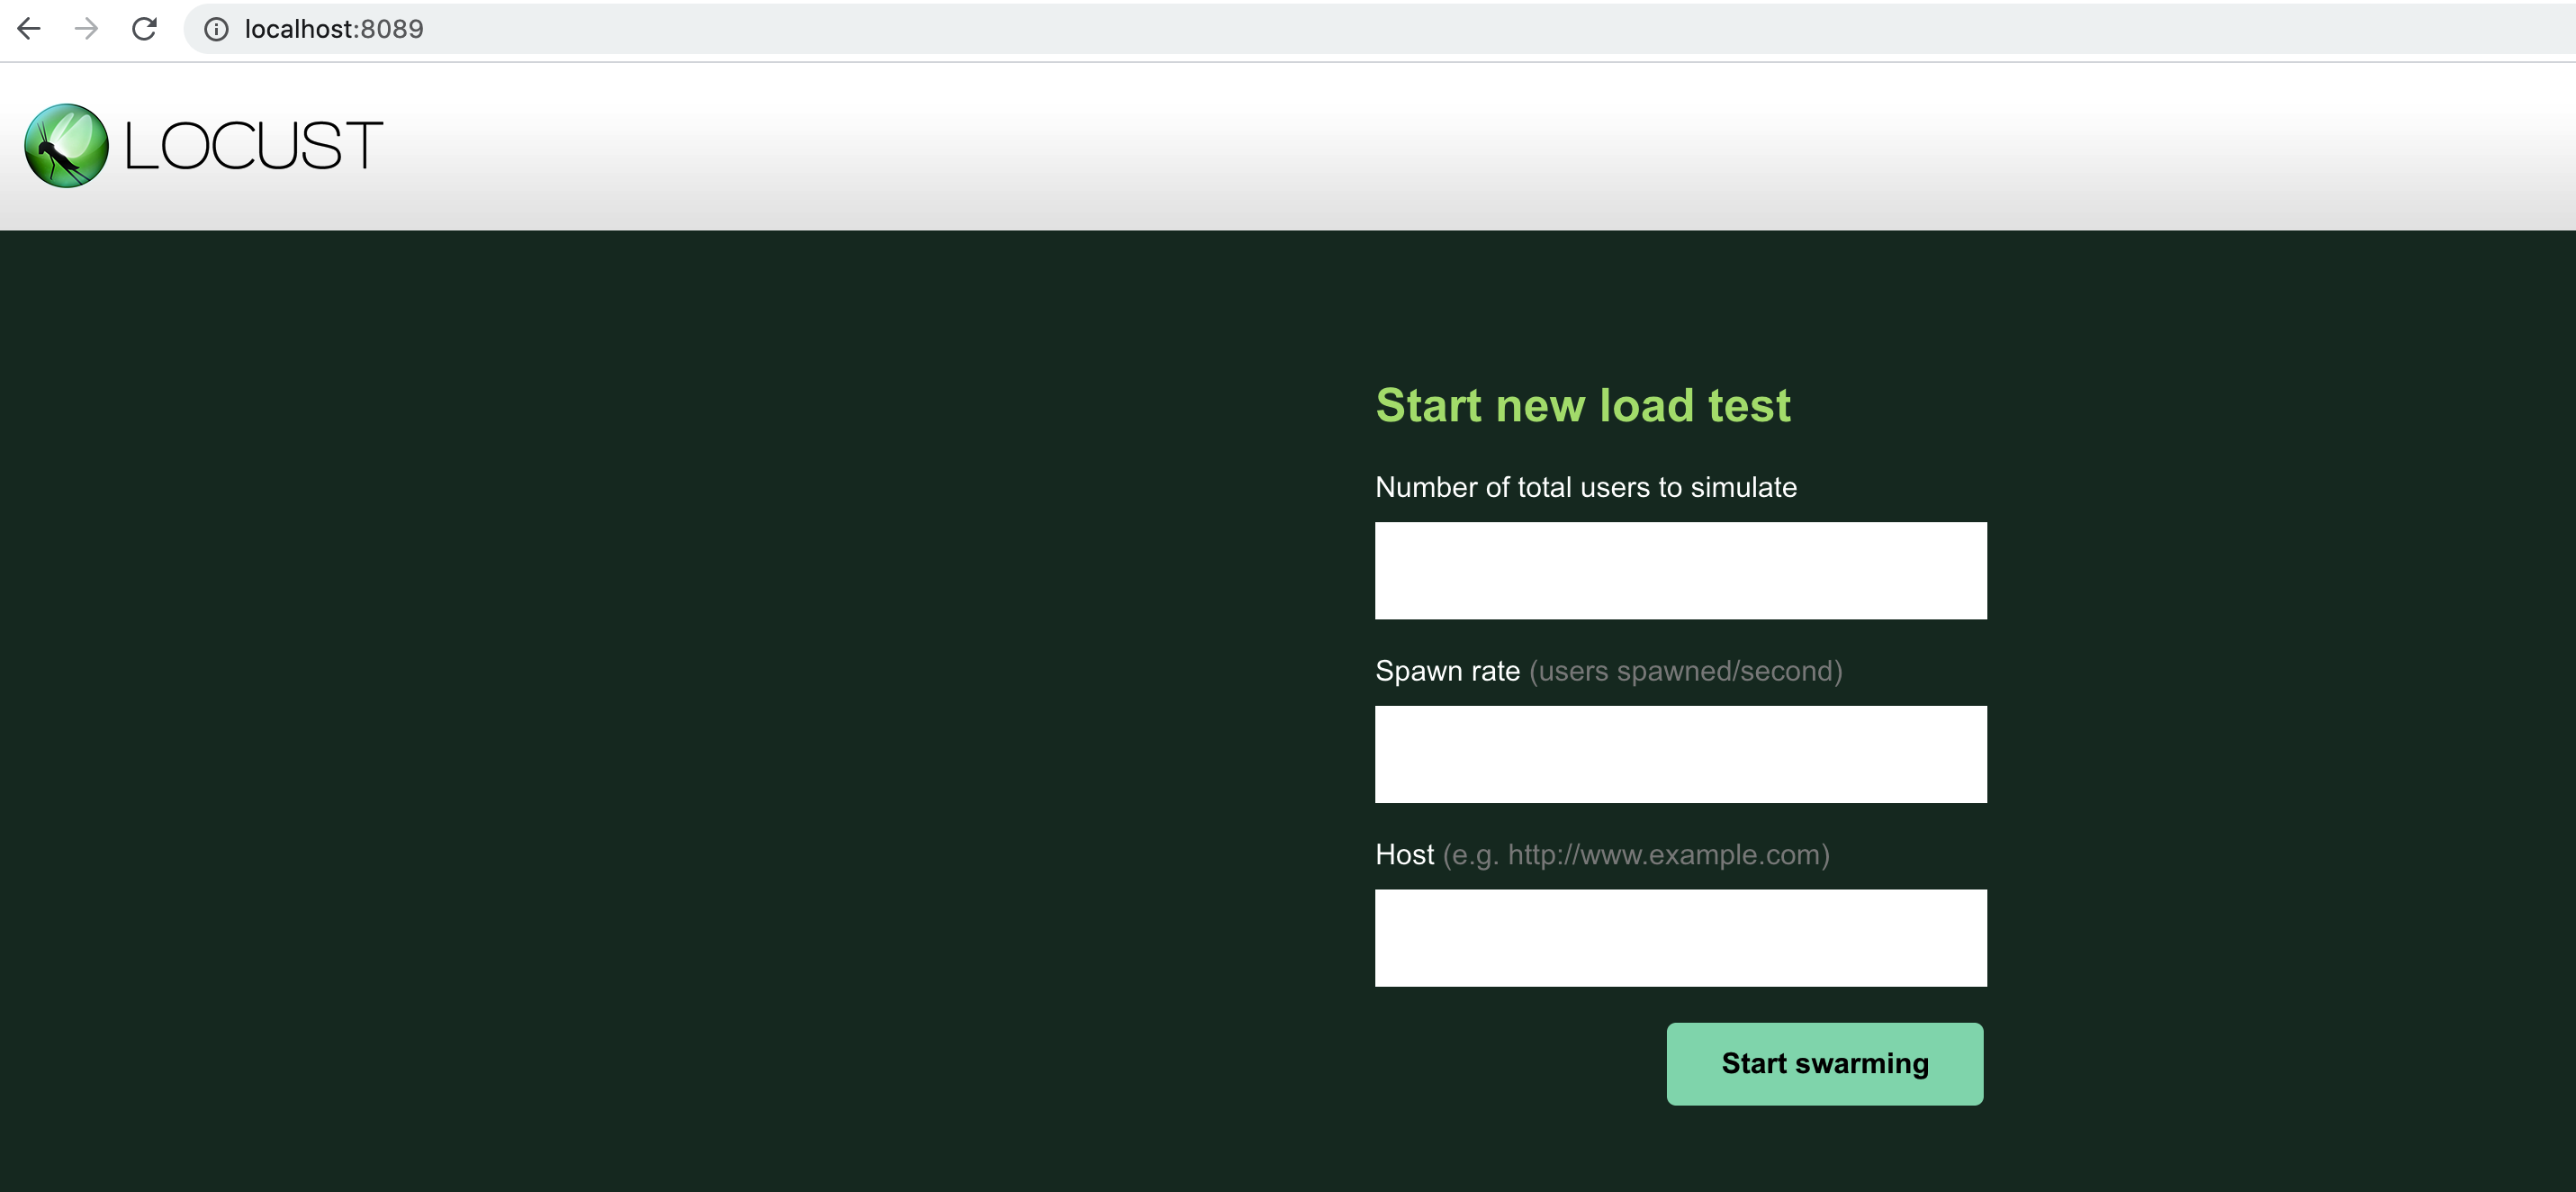
参数说明:
Number of total users to simulate: 要模拟的用户总数
Spawn rate : 每秒产生的用户数,将多少用户添加到当前用户,直到用户总数
rps: 每秒请求数
wait_time = between(0, 0) : 用于确定模拟用户在执行任务之间应等待多长时间
执行结果:
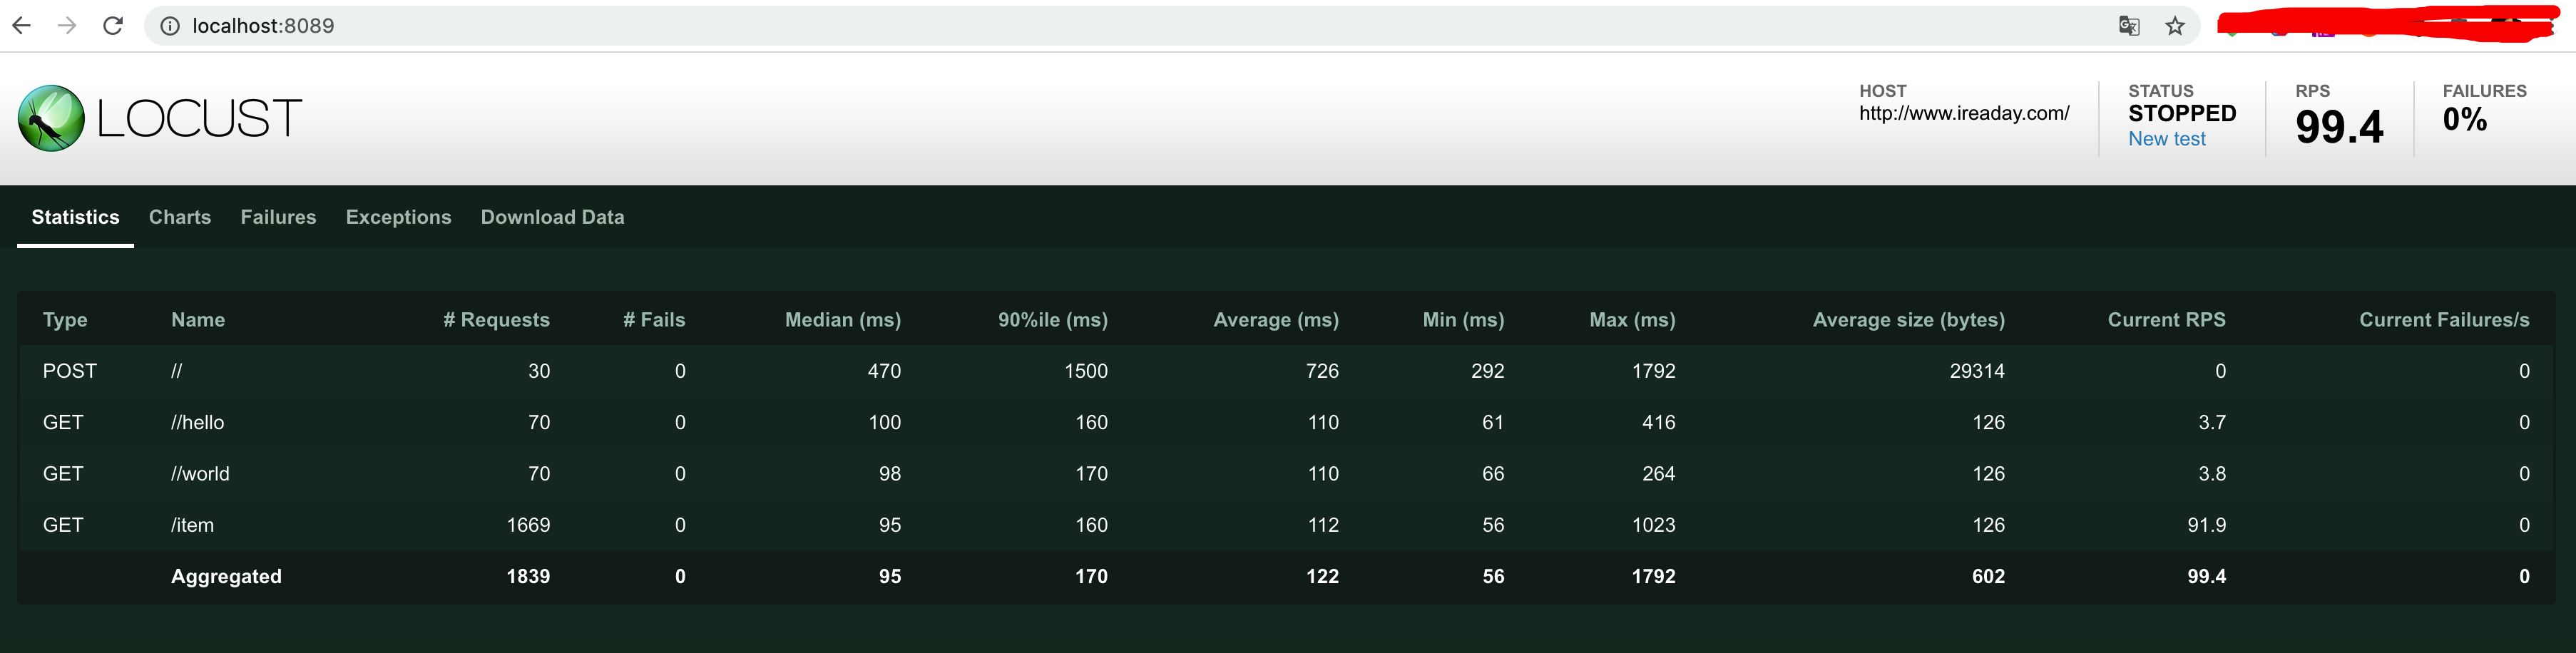
参数说明
Type :请求的类型,如GET/POST;
Name :请求的路径;
requests :已发出请求数量;
fails :请求失败的数量;
Median :响应时间的中间值(单位:毫秒);
Average :平均响应时间(单位:毫秒);
Min :请求的最小响应时间(单位:毫秒);
Max :请求的最大响应时间(单位:毫秒);
Average size (bytes) 包大小
Current RPS(current requests per second) 当前吞吐率
Current Failures/s 当前故障
Requests per second 吞吐率
tab参数说明
New test:点击该按钮可对模拟的总虚拟用户数和每秒启动的虚拟用户数进行编辑;
Statistics:类似于jmeter中Listen的聚合报告;
Charts:测试结果变化趋势的曲线展示图,分别为每秒完成的请求数(RPS)、响应时间、不同时间的虚拟用户数;
Failures:失败请求的展示界面;
Exceptions:异常请求的展示界面;
Download Data:测试数据下载模块, 提供三种类型的CSV格式的下载,分别是:Statistics、responsetime、exceptions;