<Chapter1-Chapter10, 待更>
Chapter11- 应用机器学习的建议
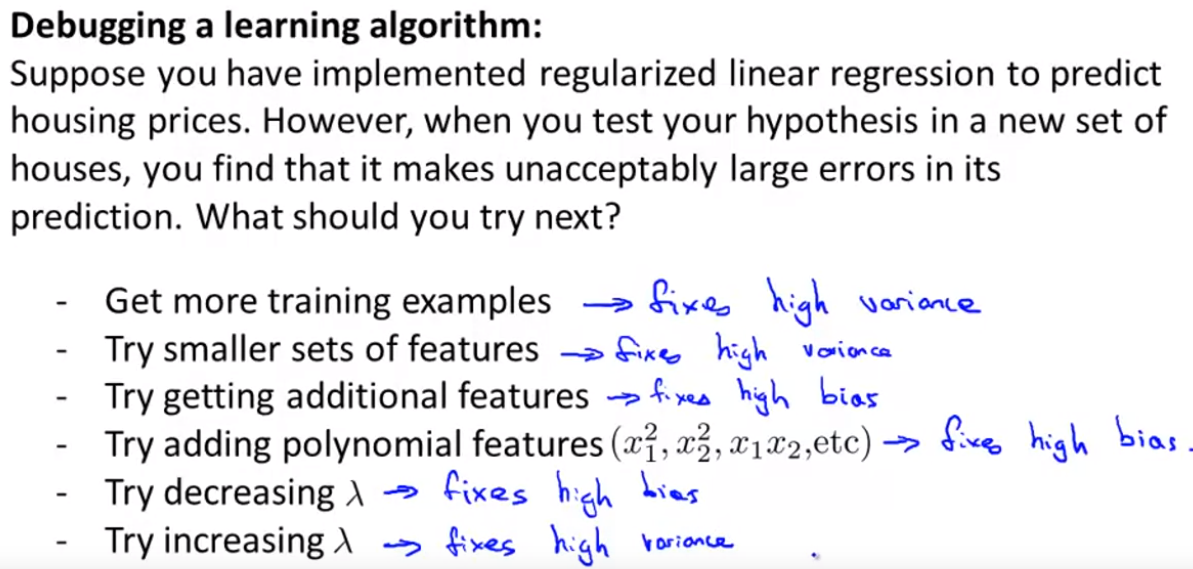
1) 当机器学习系统工作不如预期的时候怎么做?

- A diagnostic will guide user on which option may work, and which one may not. Then, what to do next? The following.
2) Evaluating a hypothesis: split the data set into: training set (70%), and test set (30%), and see the test error.
3) Model selection problem: how to decide if the degree of polynomial, how big the lamda, etc.
- Get parameters of each model, test it on the validation set, and choose the one with the lowest validation error.
- Note: It's validation set to evaluate your model, not the test set. Reason: test set would be used to evaluate the generization error (previous section).
- data set -> training/validation/test set (60%/20%/20%).
4) Diagnosing bias and variance: know your hypothesis is suffering underfitting or overfitting.
- high bias: training error and validation error are both high.
- high variance: training error is low, but validation error is high.
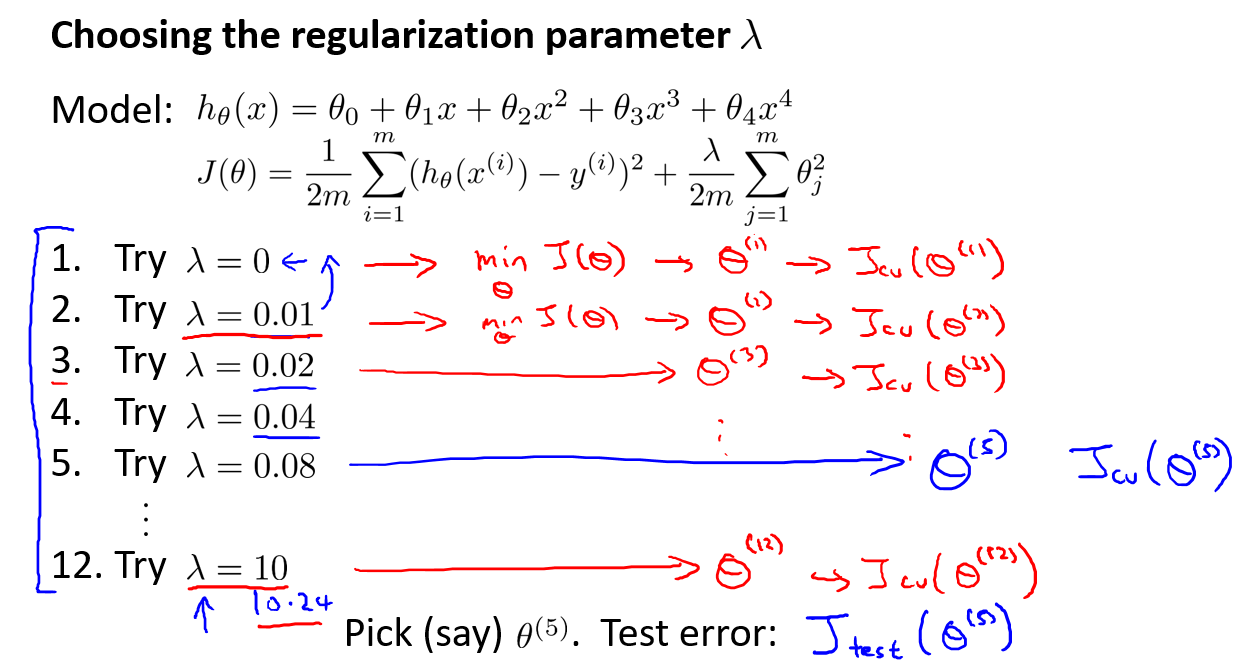
5) regularizaiton and bias/variance - Choosing lamda
6) learning curve - Error change with sample number increases.
- Good model v.s. High bias v.s. High variance (more training example will help for this case).
7) Revisit - Summary
NN: Overfitting+Regularization is better than underfitting. The cost is computational expense.
Chapter12 Machine learning system design
1,The recommended approach to solving machine learning problems is to:
- Start with a simple algorithm, implement it quickly, and test it early on your cross validation data.
- Plot learning curves to decide if more data, more features, etc. are likely to help.
- Manually examine the errors on examples in the cross validation set and try to spot a trend where most of the errors were made.
It is difficult to tell which of the options will be most helpful. A good way is to do the error analysis.
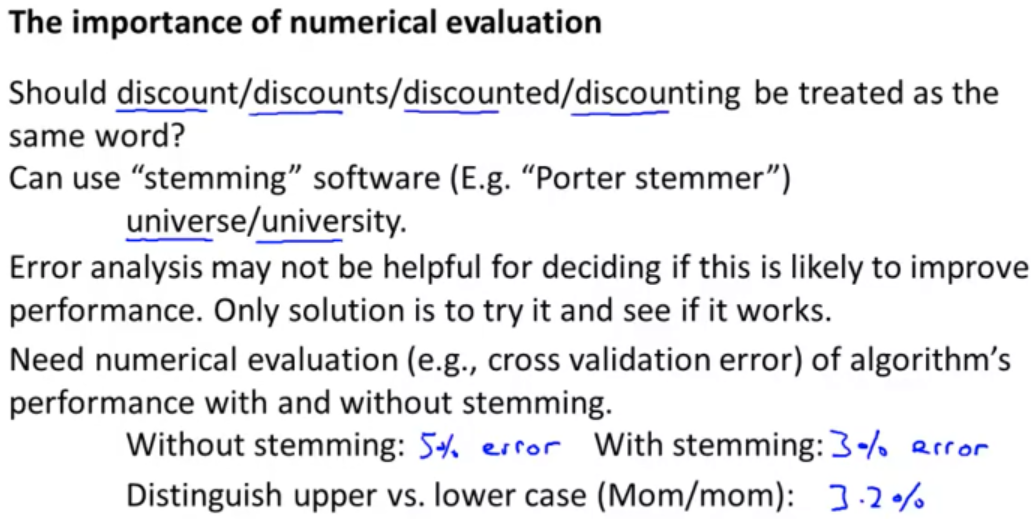
2, Error analysis
3, Handling skewed classes
What is skewed classes: one class has a lot of more classes than another, just like the cancer case.
What's its difference: Always output the class with most examples can still get a good accuracy.
A different evaluation error metric: Precision/Recall.

4, In many application, we want to control how to do the trade off between precision (查准率) and recall (查全率).
The way to control: adjusting the threshold of the classifying algorithm.
Is there a way to choose the threshold automatically? Or a similar question is how to compare precision/recall numbers?
- The answer is F1 score. Only compare the one single index.
- Choose the threshold that gives the highest F1 score.
5, Large data's importance: The below graph.
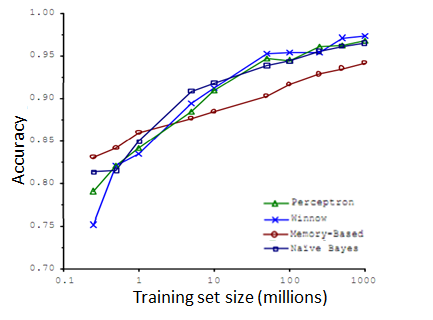
Why is that? - Larege data rationale.

To better use large data set, two things need to make sure:
- We train a algorithm with a large number of parameters (to learn complex function).
- The feature contains sufficient information to be able to predict the result correctly.
Chapter13 Clustering - An unsupervised Algorithm
1, K-means algorithm.
Steps: 1) Cluster assignment; 2) Move centroid.

2, Optimization objective - Cost function, also called distortion function(distortion of the K-mean algorithm).

Note the meaning of the each step.
What optimization objective can do?
- Knowing if K-mean is working correctly.
- To avoid local optima.
3, Random initialization
- The recommanded way:
-
What can be done if K-mean get stuck by local optima:
-
Try random initialization many times.
- Choose the one gives the lowest cost.
- Note: In the case of small cluster numbers, a few tries (2-5) can always give good results.
-

4, Choosing the number of the clusters
- Mostly, it is by hand (human insight).
- Sometimes, elbow method will work. The other time, choose the number based on the purpose.
Chapter14 Dimensional Reduction
1, Motivation: Data compression and visualizaiton.
- Data visualization: reduce the dimension form N (N>3) dimensions to k dimensions (k <=3).
- Save memory and speed up the algorithms.
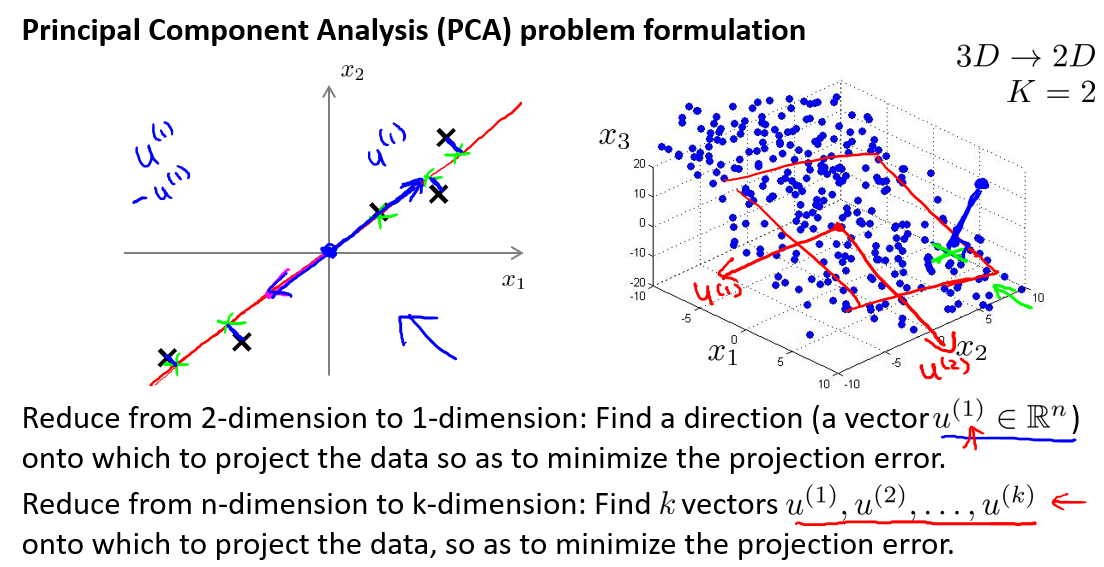
2, Most popular tool or algorithm to do dimensional reduction: PCA (Principle Component Analysis).
- What is PCA: PCA is to find a lower dimensional surface, onto which to project the data so that the sum of squares of these little blue line segments is minimized.
-
- Difference between PCA and linear regression.
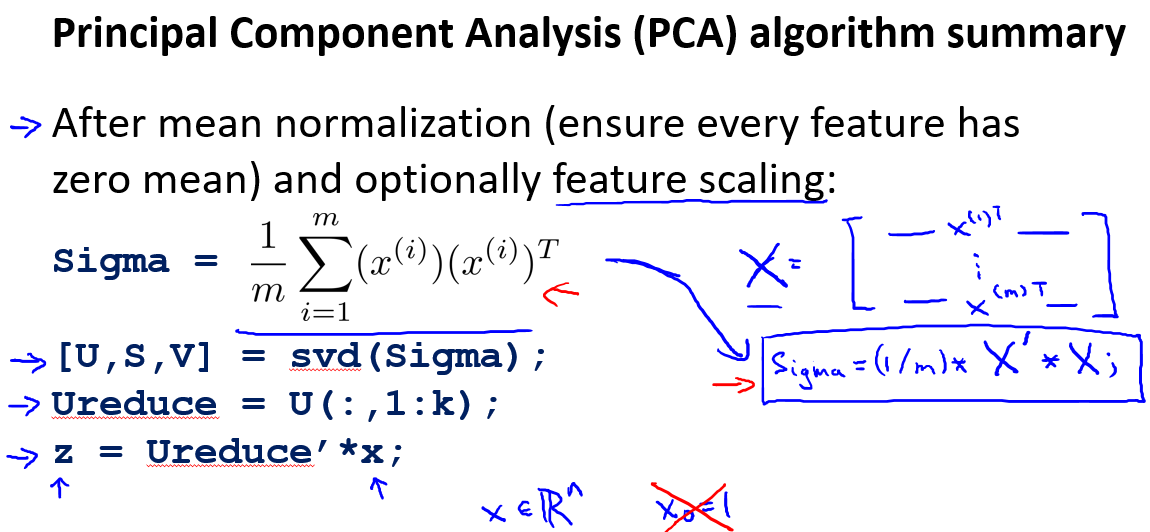
3, Steps of PCA algorithms
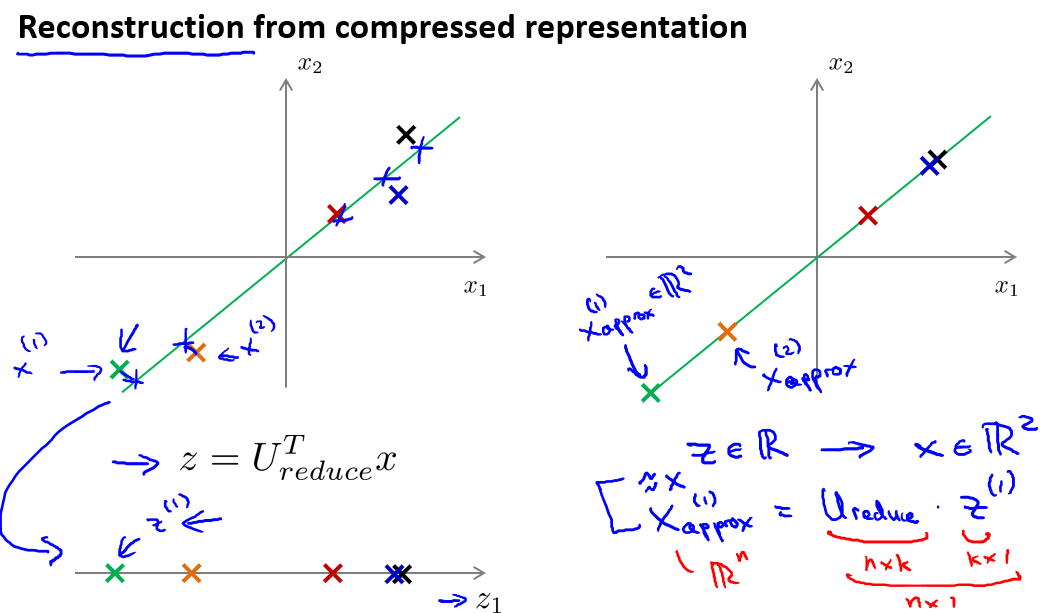
4, Reconstruction from compressed representation
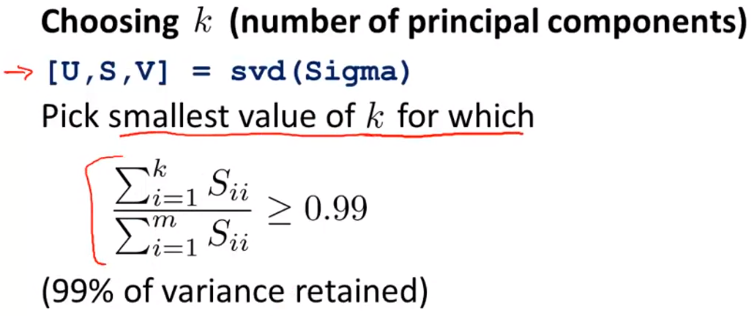
5, How to choose K?
6, Apply the PCA
- For algorithms speed up, like in ML or linear regression. And save memory.
- Bad use case of PCA: to avoid overfitting.
- Why? because PCA throws away or reduces the dimension of your data without knowing what the values of y is, it might also throw away some valuable information. The right way is to use regularization to avoid overfitting.
- Do not use PCA untill you have to (use original data first).
Chapter15 Anomaly Detection
1, What is anomaly detection? - A very common concept used in my work.
- We define a "model" p(x) that tells us the probability the example is not anomalous.
- We also use a threshold ϵ (epsilon) as a dividing line so we can say which examples are anomalous and which are not.
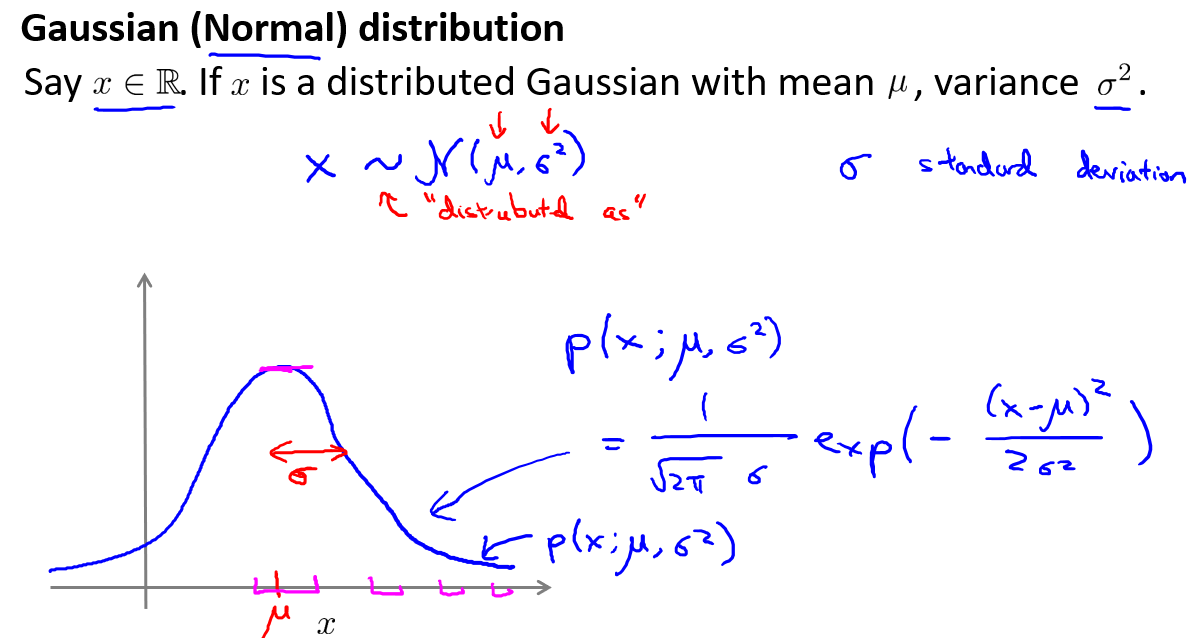
2, Gaussian distribution and anomaly detection algorithms.
- Guassian distribution

- Evaluating an anomaly detection system and determin the threshold (ϵ).
- To evaluate our learning algorithm, we take some labeled data, categorized into anomalous and non-anomalous examples.
- Split the data 60/20/20 training/CV/test and then split the anomalous examples 50/50 between the CV and test sets.
-

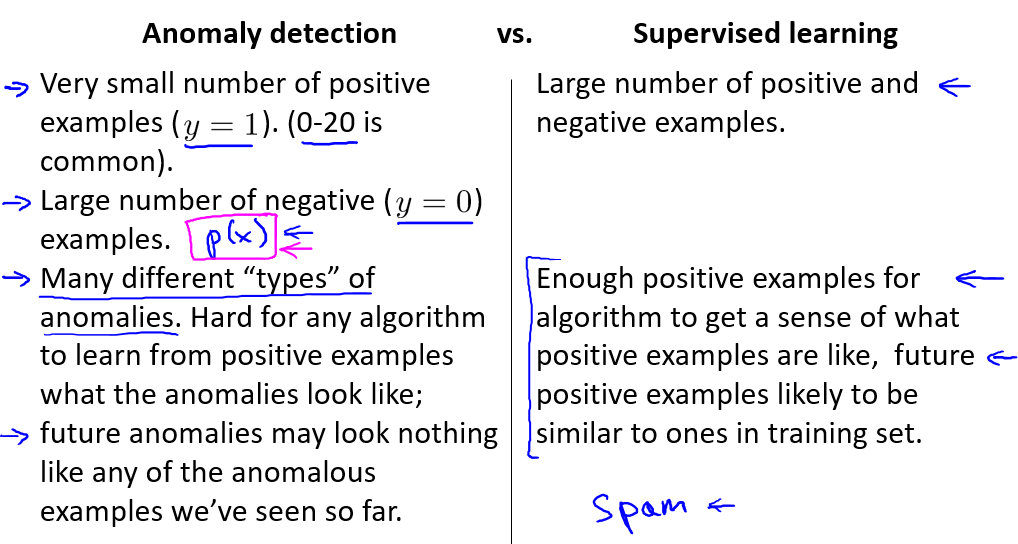
3, Anomaly Detection vs. supervised learning - how to choose?
- The cases with a lot of both positive and negative examples - supervised learning.
- The cases with few positivie examples - Anomaly detection.
4, Choosing what feature to use.
- Check if the features are gaussian distribution: if yes, good, do nothing; if not, try to transform it to let it meet gaussian.
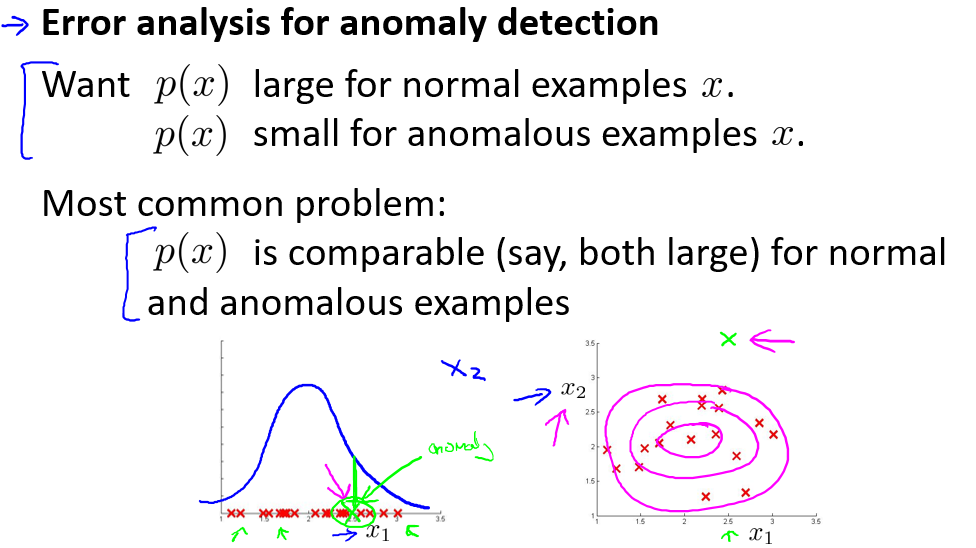
- One common problem is when p(x) is similar for both types of examples (large for both positive and negative cases).
- Error analysis for anomaly detection:
- Choose features that might take on unusually large or small values in the event of an anomaly.
5,Multivariate Gaussian Distribution - Feature's dependency assumption not work.
A very good note: https://www.cnblogs.com/newbyang/p/10338697.html
<chapter16 skip for now>
Chapter17 Large Scale Machine Learning
1, Guideline of this chapter:
Why large scale dataset: higher accuracy.
The problem of large scale: computational load.
The things need to do for large scale machine learning: cheaper algorithm, or ways to save time.
- Two ideas: stochastic gradient descent, and map reduce.
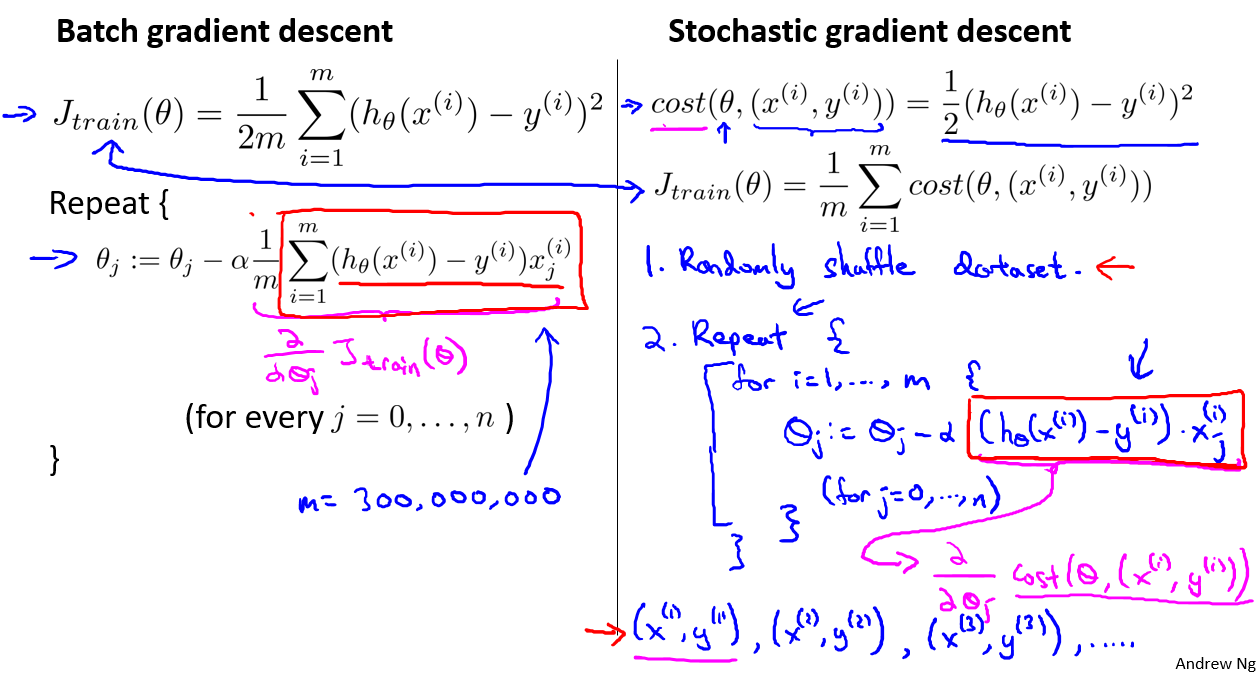
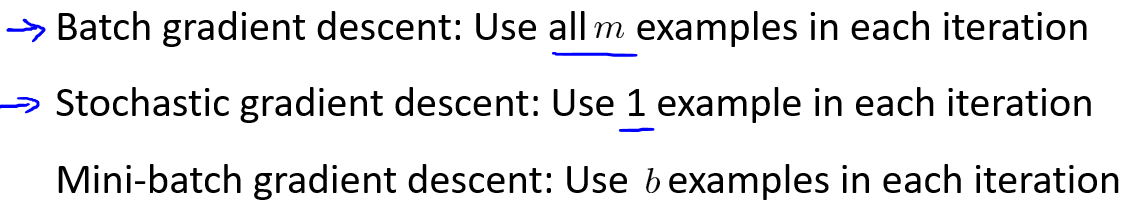
2, Stochastic gradient descent
- Concept:
- A derivative way:Mini-batch gradient descent.
- Concept:
-
Can be faster compared with batch GD and stochastic GD:
-
Faster than batch GD: straight forward.
-
Faster than stochastic GD: with appropriate vectorization implementation, mini-batch GD can take the advantage of batch computation.
-
- Concept:
3,Stochastic gradient descent converge
4,Online learning
- 在线学习算法是指,对于一个成型的模型,每次有新的数据来临时,对参数进行更新,更新之后丢弃这个数据,因为不断有新的数据来临,所以不是用整个数据集一次性进行更新参数。
- The algorithm that we apply to it is really very similar to this schotastic gradient descent algorithm, only instead of scanning through a fixed training set, we're instead getting one example from a user, learning from that example, then discarding it and moving on.
5, Map-Reduce
- Seperate the tasks/data set into multiple machines or machine with multiple cores, to speed up the computation.
- Note: when parallelizing with a multi-core machine, some numerical linear algebra libraries can automatically parallelize their linear algebra operations across multiple cores within the machine.
Week18 Photo OCR
A good note on Photo OCR: http://www.fanyeong.com/2017/08/08/machine-learning-photo-ocr/
More details:
1, Pipeline
- A system with several components, several of which are machine learning problem.
- A typical Photo OCR pipeline:
- text detection -> character segmentation -> character classification.
- text detection: see the next.
- character segmentation: supervised learing method. Classifier: can the sliding window split in the middle?
- character classification:learned in the previous chapter. The method could be NN, or SVM, etc.
2, text detection method: Supervised learning method.
- try different silding window size to do the sliding window classifier.
- Resize (re-sample) the patches to a fixed size as the data set before feeding them into the sliding window classifier.
- Mark the region out with text, and expand it to the nearby.
- Filter out the regions with strange aspect ration. Then, done!
3, Artifact data systhesis
- Creating data from scratch.
- Creating data by adding distortions.
4, Ceiling analysis: decide how to spend your resources.