elk有三个主要组成部分
elasticsearch 是一个基于Lucene的搜索服务器。它提供了一个分布式多用户能力全文搜索引擎,用来存储数据。logstat由JRuby语言编写,基于消息(message-based)的简单架构,并运行在java虚拟机上,主要负责 收集和搜索日志 过滤日志 转发日志 提供搜索日志的客户端只需要 安装logstat即可。
kibana 是一个开源和免费的工具,可以帮助您汇总,分析和搜索重要数据日志并提供友好的web界面。
===================================================================
elk部署之环境准备
ip 系统版本 配置要求
192.168.7.139 centos7.3 最低2G内存 2颗CPU
192.168.7.140 centos7.3 最低2G内存 2颗CPU
环境准备
1)关闭防火墙和selinux
2)时间同步
3)设置好主机名称
4)硬件要求
5)java环境安装
elk服务器上的操作步骤
1 java环境安装
[root@linux-node1 ~]# yum install java -y
[root@linux-node1 ~]# java -version
openjdk version "1.8.0_201"
OpenJDK Runtime Environment (build 1.8.0_201-b09)
OpenJDK 64-Bit Server VM (build 25.201-b09, mixed mode)
2 配置epel yum源
[root@linux-node1 ~]# wget http://dl.fedoraproject.org/pub/epel/epel-release-latest-7.noarch.rpm
[root@linux-node1 ~]# rpm -ivh epel-release-latest-7.noarch.rpm
3 elasticsearch安装
下载并安装GPG key
[root@linux-node1 ~]# rpm --import https://packages.elastic.co/GPG-KEY-elasticsearch
添加yum源
[root@linux-node1 ~]# cat /etc/yum.repos.d/elasticsearch.repo
[elasticsearch-2.x]
name=Elasticsearch repository for 2.x packages
baseurl=http://packages.elastic.co/elasticsearch/2.x/centos
gpgcheck=1
gpgkey=http://packages.elastic.co/GPG-KEY-elasticsearch
enabled=1
在安装elasticsearch之前 需要对文件 /etc/passwd /etc/group进行操作
[root@linux-node1 ~]# chattr -i /etc/passwd
[root@linux-node1 ~]# chattr -i /etc/group
安装elasticsearch
[root@linux-node1 ~]# yum install -y elasticsearch
启动服务并加入开机自启动
[root@linux-node1 ~]# systemctl daemon-reload
[root@linux-node1 ~]# systemctl enable elasticsearch.service
[root@linux-node1 ~]# systemctl start elasticsearch.service
4 管理配置elasticsearch
4.1 修改elasticsearch的配置文件
备份原配置文件
cp /etc/elasticsearch/elasticsearch.yml /etc/elasticsearch/elasticsearch.yml-20190325
修改后的配置文件如下
[root@linux-node1 elasticsearch]# egrep -v '^#' /etc/elasticsearch/elasticsearch.yml
cluster.name: ylpw ##集群名字
node.name: linux-node1 ##节点名字
path.data: /data/es-data ##数据目录
path.logs: /var/log/elasticsearch ##elasticsearch日志所在路径
bootstrap.memory_lock: true ##是否锁定内存 开启
network.host: 0.0.0.0 ##默认是所有网段
http.port: 9200 ##端口
创建elasticsearch的数据目录并进行授权
[root@linux-node1 elasticsearch]# mkdir /data/es-data
[root@linux-node1 elasticsearch]# chown elasticsearch.elasticsearch /data/es-data/ -R
重启elasticsearch服务
systemctl restart elasticsearch.service
通过浏览器访问看是否启动
http://192.168.7.140:9200/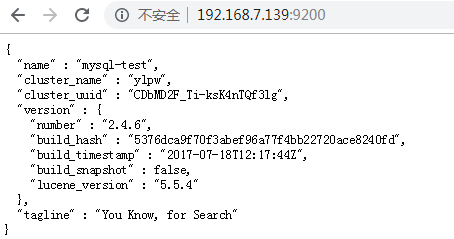
5 安装elasticsearch插件
5.1 安装Elasticsearch集群管理插件 head(此插件是集群插件)
##在任何目录下都可以执行以下命令
[root@linux-node1 elasticsearch]# /usr/share/elasticsearch/bin/plugin install mobz/elasticsearch-head
安装后通过浏览器进行访问 head插件
http://192.168.7.140:9200/_plugin/head/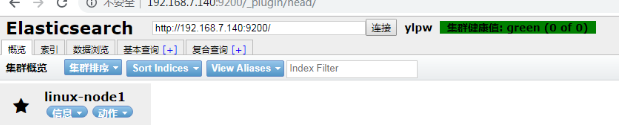
具体详细操作请见 博客 https://www.cnblogs.com/w787815/p/6676335.html
部署elk集群
第二台 elasticsearch 部署和第一台一样 只不过在配置文件上有点区别 需要添加2条命令 目的是把节点手动加入到集群中去
通过组播进行通信,会通过cluster进行查找,如果无法通过组播查询,修改成单播即可,配置文件中指定,图中的有*号代表主节点
在第二台的elasticsearch 的配置文件中添加下面一行
cat /etc/elasticsearch/elasticsearch.yml
discovery.zen.ping.unicast.hosts: ["192.168.230.128", "192.168.230.129"]
#把同一集群的节点添加到这里,方便它们互相认识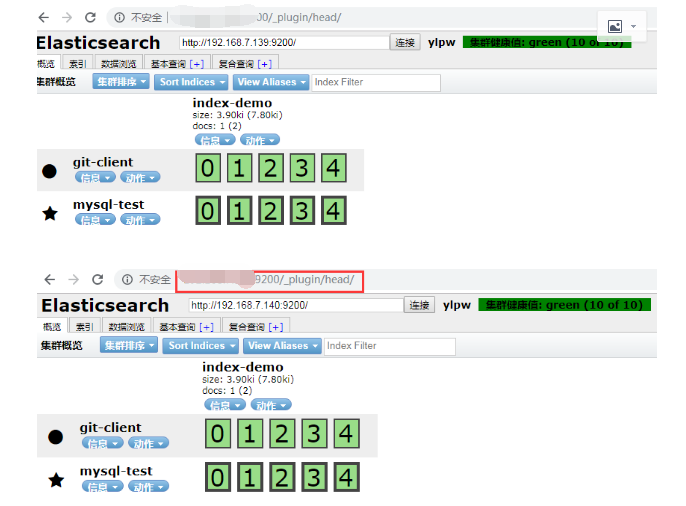
5.2 安装kopf监控插件
[root@linux-node1 elasticsearch]# /usr/share/elasticsearch/bin/plugin install lmenezes/elasticsearch-kopf
访问kopf监控插件:http://192.168.7.140:9200/_plugin/kopf
从下图可以看出节点的负载,cpu适应情况,java对内存的使用(heap usage),磁盘使用,启动时间
到此为止 elk搭建完毕
Logstash日志收集实践
在学习Logstash之前,我们需要先了解以下几个基本概念:
logstash收集日志基本流程: input-->codec-->filter-->codec-->output
1.input:从哪里收集日志。
2.filter:发出去前进行过滤
3.output:输出至Elasticsearch或Redis消息队列
4.codec:输出至前台,方便边实践边测试
5.数据量不大日志按照月来进行收集
6.1 logstat安装(需要部署在被收集日志的客户端机器上)
Logstash需要Java环境,所以直接使用yum安装。
载并安装GPG key
[root@linux-node1 ~]# rpm --import https://packages.elastic.co/GPG-KEY-elasticsearch
添加logstash的yum仓库
[root@linux-node1 ~]#cat /etc/yum.repos.d/logstash.repo
[logstash-2.3]
name=Logstash repository for2.3.x packages
baseurl=https://packages.elastic.co/logstash/2.3/centos
gpgcheck=1
gpgkey=https://packages.elastic.co/GPG-KEY-elasticsearch
enabled=1
4.安装Logstash
[root@linux-node1 ~]#yum install -y logstash
通常使用rubydebug方式前台输出展示以及测试
[root@linux-node1 /]# /opt/logstash/bin/logstash -e 'input { stdin {} } output { stdout{codec => rubydebug} }'
OpenJDK 64-Bit Server VM warning: If the number of processors is expected to increase from one, then you should configure the number of parallel GC threads appropriately using -XX:ParallelGCThreads=N#这个jdk的警告就是显示需要加CPU
hello #输入
Settings: Default pipeline workers: 1
Pipeline main started
{
"message" => "hello",
"@version" => "1",
"@timestamp" => "2017-01-03T17:00:24.285Z",
"host" => "linux-node1.example.com"
}
把内容写到elasticsearch中
[root@linux-node1 elasticsearch]# /opt/logstash/bin/logstash -e 'input { stdin {} } output { elasticsearch { hosts => ["192.168.7.140:9200"]} }'
OpenJDK 64-Bit Server VM warning: If the number of processors is expected to increase from one, then you should configure the number of parallel GC threads appropriately using -XX:ParallelGCThreads=N
Settings: Default pipeline workers: 1
Pipeline main started
this is a test!!!
qqqqqqqqqqqqqq
ssssssssssssssssssss
aaaaaaaaaaaaaaaaaaaaa
xxxxxxxxxxxxxxxxxxxx
heheh
hehehe
数据浏览,查看写得数据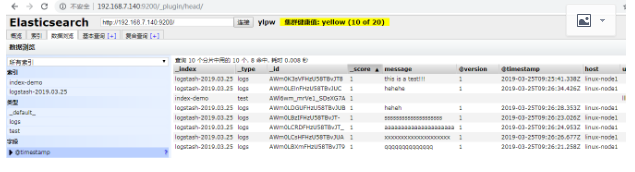
写到标准输出,同时写到elas里面
在elasticsearch中写一份,同时在本地输出一份,也就是在本地保留一份文本文件,也就不用在elasticsearch中再定时备份到远端一份了。此处使用的保留文本文件三大优势:1)文本最简单 2)文本可以二次加工 3)文本的压缩比最高
[root@linux-node1 elasticsearch]# /opt/logstash/bin/logstash -e 'input { stdin {} } output { elasticsearch { hosts => ["192.168.7.140:9200"]} stdout { codec => rubydebug}}'
OpenJDK 64-Bit Server VM warning: If the number of processors is expected to increase from one, then you should configure the number of parallel GC threads appropriately using -XX:ParallelGCThreads=N
Settings: Default pipeline workers: 1
Pipeline main started
222222222222
{
"message" => "222222222222",
"@version" => "1",
"@timestamp" => "2019-03-25T09:40:01.766Z",
"host" => "linux-node1"
}
rrrrrrrrrrrrrrrrr
{
"message" => "rrrrrrrrrrrrrrrrr",
"@version" => "1",
"@timestamp" => "2019-03-25T09:40:04.297Z",
"host" => "linux-node1"
}
============================================================
通过配置文件进行配置logstat
配置链接官网
https://www.elastic.co/guide/en/logstash/2.3/configuration.html
进入到logstat的配置文件目录中
[root@linux-node1 logstash]# cd /etc/logstash/conf.d/
编辑一个新的配置文件
[root@linux-node1 conf.d]# cat /etc/logstash/conf.d/01-logstash.conf
input { stdin {} }
output {
elasticsearch {
hosts => ["192.168.7.140:9200"]
}
stdout {
codec => rubydebug
}
}
执行命令运行这个文件
##其中 -f 指定配置文件的路径
[root@linux-node1 conf.d]# /opt/logstash/bin/logstash -f /etc/logstash/conf.d/01-logstash.conf
OpenJDK 64-Bit Server VM warning: If the number of processors is expected to increase from one, then you should configure the number of parallel GC threads appropriately using -XX:ParallelGCThreads=N
Settings: Default pipeline workers: 1
Pipeline main started
2019-03-36 15:00
{
"message" => "2019-03-36 15:00",
"@version" => "1",
"@timestamp" => "2019-03-26T09:41:12.715Z",
"host" => "linux-node1"
}
刷新浏览器查看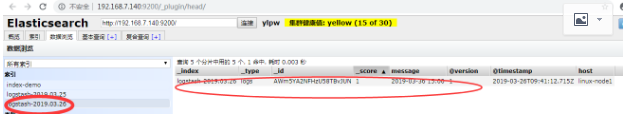
=============================================================
a logstash收集系统日志 直接写到elasticsearch
在任意一个目录下都可以 编辑文件
[root@linux-node1 tmp]# cat sys-file.conf
input {
file {
path => "/var/log/messages" ##系统日志的路径
type => "system" ##设置类型
start_position => "beginning" ##日志从头开始收集
}
}
output {
elasticsearch { ##日志输出到elasticsearch
hosts => ["192.168.7.140:9200"] ##elasticsearch所在的主机
index => "system-%{+YYYY.MM.dd}" ##日志索引的格式
}
}
b logstat增加收集elasticsearch本身自带的java日志
[root@linux-node1 tmp]# cat sys-file.conf
input {
file {
path => "/var/log/messages"
type => "system"
start_position => "beginning"
}
file {
path => "/var/log/elasticsearch/ylpw.log"
type => "es-error"
start_position => "beginning"
}
}
##使用类型来进行判断,是system的收集到system的索引里,是es-error的收集到es-error里
output {
if [type] == "system" {
elasticsearch {
hosts => ["192.168.7.140:9200"]
index => "system-%{+YYYY.MM.dd}"
}
}
if [type] == "es-error" {
elasticsearch {
hosts => ["192.168.7.140:9200"]
index => "es-error-%{+YYYY.MM.dd}"
}
}
}
if判断详细用法
https://www.elastic.co/guide/en/logstash/2.3/event-dependent-configuration.html
配置好logstash的文件后 通过命令启动logstat 日志才会能够被收集到
[root@mysql-test tmp]# /opt/logstash/bin/logstash -f /tmp/sys-file.conf &
但现在有一个问题,java日志打印出来的是堆栈,每一个都给我收集一行了,文件都是按行收集的,这没法看,连不起来,让开发怎么看
我们希望看到的是这样一个日志格式,而不是像Elasticsearch中那样,一行一行的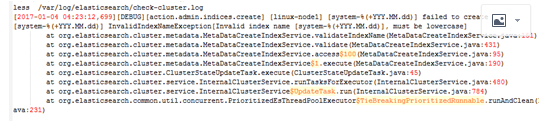
需要用标准输出格式进行输出
那我应该怎样把多行变为一行呢,我们发现上面的日志格式是[]时间点开头到下一个[]时间点是为一个事件,我们引入Codec multiline插件
[root@linux-node1 conf.d]# cat multilne.conf
input {
stdin {
codec => multiline {
pattern =>"^[" #以中括号开头,转义
negate => true
what =>"previous"
}
}
}
output {
stdout {
codec =>"rubydebug"
}
}
把格式化后的插件引入到文件中
cat sys-file.conf
input {
file {
path => "/var/log/messages"
type => "system"
start_position => "beginning"
}
file {
path => "/var/log/elasticsearch/ylpw.log"
type => "es-error"
start_position => "beginning"
codec => multiline {
pattern => "^["
negate => true
what => "previous"
}
}
}
##使用类型来进行判断,是system的收集到system的索引里,是es-error的收集到es-error里
output {
if [type] == "system" {
elasticsearch {
hosts => ["192.168.7.140:9200"]
index => "system-%{+YYYY.MM.dd}"
}
}
if [type] == "es-error" {
elasticsearch {
hosts => ["192.168.7.140:9200"]
index => "es-error-%{+YYYY.MM.dd}"
}
}
}
7 kibana部署安装
https://www.elastic.co/guide/en/kibana/4.5/index.html
7.1 安装kibana
下载并安装公共签名的密钥
rpm--import https://packages.elastic.co/GPG-KEY-elasticsearch
编辑yum源
cat /etc/yum.repos.d/kibana.repo
[kibana-4.5]
name=Kibana repository for 4.5.x packages
baseurl=http://packages.elastic.co/kibana/4.5/centos
gpgcheck=1
gpgkey=http://packages.elastic.co/GPG-KEY-elasticsearch
enabled=1
yum安装kibana
[root@linux-node1 yum.repos.d]# yum install kibana -y
开启服务
/bin/systemctl daemon-reload
/bin/systemctl enable kibana.service
/bin/systemctl start kibana.service
修改kibana的配置文件
修改后的配置文件内容如下
[root@linux-node1 yum.repos.d]# grep -E -v '^#' /opt/kibana/config/kibana.yml
server.port: 5601
server.host: "0.0.0.0"
elasticsearch.url: "http://192.168.7.140:9200"
kibana.index: ".kibana"
修改配置文件后重启kibana服务
/bin/systemctl restart kibana.service
==========================================
通过浏览器访问 http://192.168.7.140:5601
创建索引
模式允许您使用*通配符定义动态索引名称。例子:logstash - *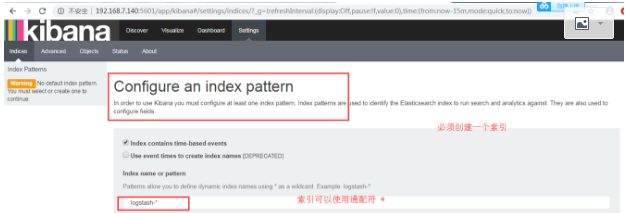
创建 es-error索引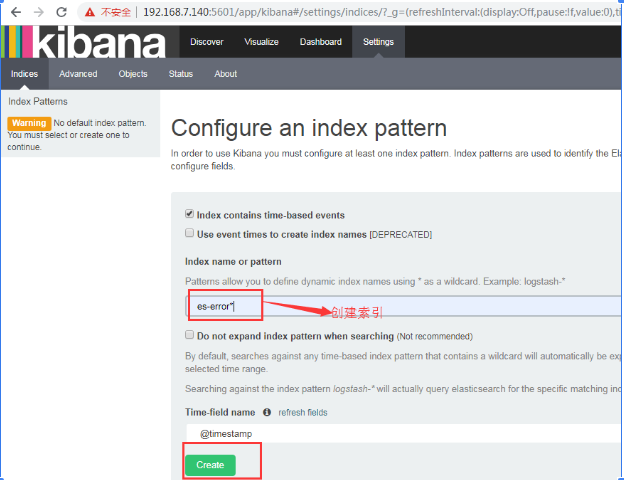
点击Discover 查看图形
点击Discover【发现】默认是最后十五分钟,我们把它改为今天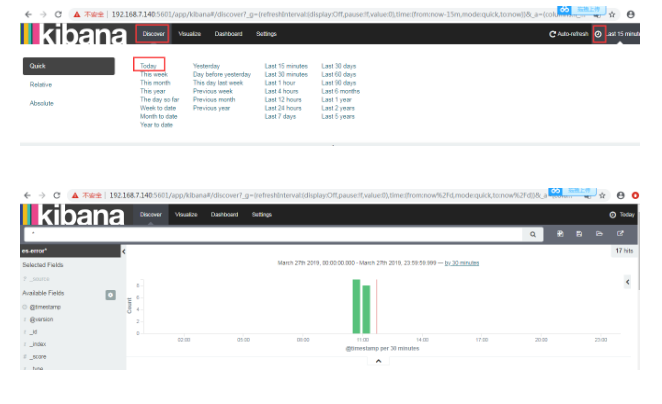
logstat收集nginx日志
首先nginx的日志格式需要 用json格式输出
在nginx的主配置文件中进行日志格式的定义
log_format json '{"@timestamp":"$time_iso8601",'
'"host":"$server_addr",'
'"clientip":"$remote_addr",'
'"size":$body_bytes_sent,'
'"responsetime":$request_time,'
'"upstreamtime":"$upstream_response_time",'
'"upstreamhost":"$upstream_addr",'
'"http_host":"$host",'
'"url":"$uri",'
'"xff":"$http_x_forwarded_for",'
'"referer":"$http_referer",'
'"agent":"$http_user_agent",'
'"remote":"$remote_user",'
'"time_local":"[$time_local]",'
'"request_body":"$request_body",'
'"upstream_cache_status":"$upstream_cache_status",'
'"status":"$status"}';
logstat收集nginx日志的配置文件(线上的配置)
cat message.conf
input {
file {
type => "nginx-access"
path => "/opt/logs/nginx/api.acc.log"
codec=>"json"
}
}
filter {
if [type] == "nginx-access" {
geoip {
source => "xff"
target => "geoip"
database =>"/opt/logstash-6.0.0/tmp/GeoLite2-City.mmdb"
#database =>"/opt/logstash-6.0.0/vendor/bundle/jruby/2.3.0/gems/logstash-filter-geoip-5.0.1-java/vendor/GeoLite2-City.mmdb"
add_field => [ "[geoip][coordinates]", "%{[geoip][longitude]}" ]
add_field => [ "[geoip][coordinates]", "%{[geoip][latitude]}" ]
}
mutate {
convert => [ "[geoip][coordinates]", "float"]
}
}
}
output {
stdout { codec => rubydebug }
elasticsearch
{
hosts => ["10.128.10.108:9200"]
index => "appnginxs-%{+YYYY.MM.dd}"
#template => "/opt/logstash/monster.json"
#template_overwrite => true
}
}
===================================================
logstat日志收集存放在消息队列 redis中
redis用来收集日志的配置文件
cat shipper.conf
input{
syslog {
type=>"system-syslog"
host =>"192.168.230.128"
port =>"514"
}
file{
path =>"/var/log/nginx/access_json.log"
codec => json
start_position =>"beginning"
type=>"nginx-log"
}
file{
path =>"/var/log/messages"
type=>"system"
start_position =>"beginning"
}
file{
path =>"/var/log/elasticsearch/check-cluster.log"
type=>"es-error"
start_position =>"beginning"
codec => multiline {
pattern =>"^["
negate => true
what =>"previous"
}
}
}
output{
if[type]=="system"{
redis {
host =>"192.168.230.128"
port =>"6379"
db =>"6"
data_type =>"list"
key =>"system"
}
}
if[type]=="es-error"{
redis {
host =>"192.168.230.128"
port =>"6379"
db =>"6"
data_type =>"list"
key =>"es-error"
}
}
if[type]=="system-syslog"{
redis {
host =>"192.168.230.128"
port =>"6379"
db =>"6"
data_type =>"list"
key =>"system-syslog"
}
}
if[type]=="nginx-log"{
redis {
host =>"192.168.230.128"
port =>"6379"
db =>"6"
data_type =>"list"
key =>"nginx-log"
}
}
}
后台启动配置文件
/usr/local/logstash-2.0.0/bin/logstash -f /tmp/nginx-access.conf &
============================================================================
编写indexer.conf作为redis发送elasticsearch配置文件
[root@linux-node2 /]# cat indexer.conf
input{
redis {
type=>"system"
host =>"192.168.230.128"
port =>"6379"
db =>"6"
data_type =>"list"
key =>"system"
}
redis {
type=>"es-error"
host =>"192.168.230.128"
port =>"6379"
db =>"6"
data_type =>"list"
key =>"es-error"
}
redis {
type=>"system-syslog"
host =>"192.168.230.128"
port =>"6379"
db =>"6"
data_type =>"list"
key =>"system-syslog"
}
redis {
type=>"nginx-log"
host =>"192.168.230.128"
port =>"6379"
db =>"6"
data_type =>"list"
key =>"nginx-log"
}
}
output{
if[type]=="system"{
elasticsearch {
hosts =>["192.168.230.128:9200"]
index =>"system-%{+YYY.MM.dd}"
}
}
if[type]=="es-error"{
elasticsearch {
hosts =>["192.168.230.128:9200"]
index =>"es-error-%{+YYY.MM.dd}"
}
}
if[type]=="system-syslog"{
elasticsearch {
hosts =>["192.168.230.128:9200","192.168.230.129:9200"]
index =>"system-syslog-%{+YYY.MM.dd}"
}
}
if[type]=="nginx-log"{
elasticsearch {
hosts =>["192.168.230.128:9200","192.168.230.129:9200"]
index =>"nginx-log-%{+YYY.MM.dd}"
}
}
}
配置完后
后台启动配置文件
/usr/local/logstash-2.0.0/bin/logstash -f /tmp/nginx-access.conf &
===========================================================================
九.ElkStack上线规划
上线ELKstack前,先做好如下规范能更好的开启ELKstack之旅。
1.标准化:
1.路径规划:/data/logs/,/data/logs/access,/data/logs/error,/data/logs/run
2.格式要求:严格要求使用json
3.命名规则: access_log error_log runtime_log system_log
4.日志切割:按天,按小时。访问,错误,程序日志按小时,系统日志按天收集。
5.原始文本: rsync推送NAS,后删除最近三天前。
5.消息队列:访问日志,写入Redis_DB6,错误日志Redis_DB7,程序日志Redis_DB8
2.工具化:
1.访问日志 Apache、Nginx、Tomcat (使用file插件)
2.错误日志 java日志、异常日志(使用mulitline多行插件)
3.系统日志/var/log/*、rsyslog (使用syslog)
4.运行日志程序写入的日志文件(可使用file插件或json插件)
5.网络日志防火墙、交换机、路由器(syslog插件)
3.集群化:
1.每台ES上面都启动一个Kibana
2.Kibana都连自己的ES
3.前端Nginx负载均衡+验证,代理至后端Kibana
4.通过消息队列来实现程序解耦以及高可用等扩展
4.监控化:
1.对ES以及Kibana、进行监控。如果服务DOWN及时处理。
2.使用Redis的list作为ELKstack消息队列。
3.Redis的List Key长度进行监控(llen key_name)。例:超过"10万"即报警(根据实际情况以及业务情况)
5.迭代化:
1.开源日志分析平台:ELK、EFK、EHK、
2.数据收集处理:Flume、heka
3.消息队列:Redis、Rabbitmq、Kafka、Hadoop、webhdfs