基本信息
N-UCLA骨架数据 raw data下载链接。
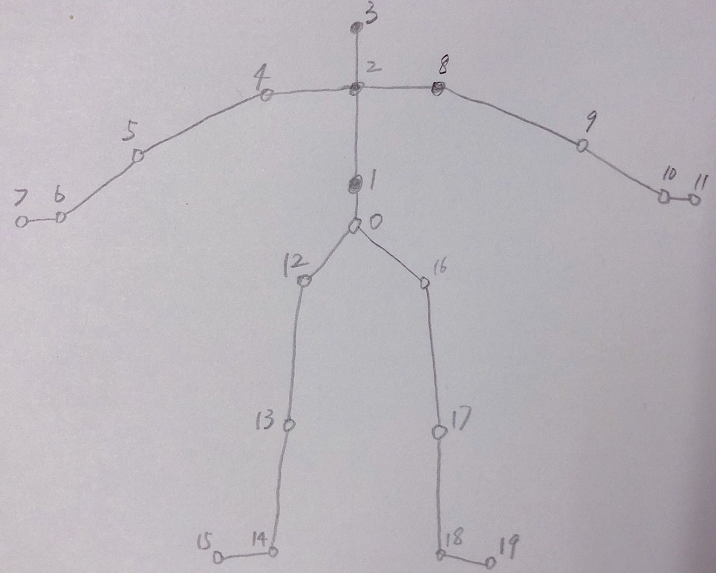
每个视频都只有一个人。人身上设置了20个节点,如下图所示:
N-UCLA骨架数据总共1484个样本,平均时长39.4帧,最长的有201帧,最短的只有1帧(a02_s09_e04_v03.json和a02_s09_e04_v02.json)。
记样本帧数为len:
0 < len < 10 ---> 10个样本
10 <= len < 30 ---> 683个样本
30 <= len < 50 ---> 445个样本
50 <= len < 100 ---> 269个样本
100 <= len < 150 ---> 65个样本
150 <= len ---> 12个样本
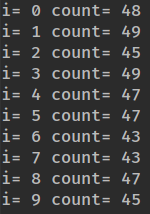
通常view1和view2作为training set,共1020个样本。view3作为validation set。N-UCLA数据集总共包含10类动作,training set的各个动作的样本数目如下:(i表示第几类,count表示样本数)

validation set的各个动作的样本数目如下:
可视化程序
import numpy as np
import sys
import json
import random
import math
import matplotlib.pyplot as plt
from mpl_toolkits.mplot3d import Axes3D

file_json = open(r'E:CSaction_researchNW-UCLAall_sqea01_s01_e00_v01.json', 'r')
data_dict = json.load(file_json)
data = np.array(data_dict['skeletons'])   # shape (T, J, D). T: time step. J:joint. D:dimension.

T, J, D = data.shape

# 相邻各节点列表,用来画节点之间的连接线
hands = [7, 6, 5, 4, 2, 8, 9, 10, 11]
legs = [15, 14, 13, 12, 0, 16, 17, 18, 19]
trunk = [0, 1, 2, 3]

# 3D展示------------------------------------------------------------------------
n = 0   # 从第n帧开始展示
m = T   # 到第m帧结束,n<m<T
fig = plt.figure()   # 先生成一块画布,然后在画布上添加3D坐标轴
plt.ion()
for i in range(n, m):
    fig.clf()
    ax = Axes3D(fig, azim=-10, elev=5)
    ax.scatter(data[i, :, 0], data[i, :, 2], data[i, :, 1], c='red', s=40.0)
    ax.plot(data[i, hands, 0], data[i, hands, 2], data[i, hands, 1], c='green', lw=2.0)
    ax.plot(data[i, legs, 0], data[i, legs, 2], data[i, legs, 1], c='green', lw=2.0)
    ax.plot(data[i, trunk, 0], data[i, trunk, 2], data[i, trunk, 1], c='green', lw=2.0)

    ax.set_xlabel("X")
    ax.set_ylabel("Y")
    ax.set_zlabel("Z")

    ax.set_xlim(-0.2, 0.4)
    ax.set_ylim(2.0, 3.2)
    ax.set_zlim(-1.0, 1.0)
    plt.pause(0.1)

plt.ioff()
plt.show()
效果:
