echarts柱状图设置渐变色

在series中加入

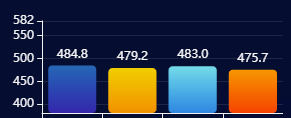
series: [{
            data:data ,
            type: 'bar',
            itemStyle: {
                //通常情况下:
                normal: {
                    barBorderRadius: 4,
                    //每个柱子的颜色即为colorList数组里的每一项,如果柱子数目多于colorList的长度,则柱子颜色循环使用该数组
                    color: function (params) {
                        var colorList = [
                            ['rgb(14,102,179)', 'rgb(51,36,169)'],
                            ['#F5cF0D', '#fa9203'],
                            ['#61dbe8', '#0785de'],
                            ['#ff9717', '#ff4518'],
                        ];
                        var index = params.dataIndex;
                        if (params.dataIndex >= colorList.length) {
                            index = params.dataIndex - colorList.length;
                        }
                        return new echarts.graphic.LinearGradient(0, 0, 0, 1,
                            [{
                                    offset: 0,
                                    color: colorList[index][0]
                                },
                                {
                                    offset: 1,
                                    color: colorList[index][1]
                                }
                            ]);
                    }
                },
            }
     
        }]

原文地址:https://www.cnblogs.com/pengsulong/p/14441668.html