Description
用 Vue.js 搭建前端,使用 echarts 做数据可视化,数据从 Flask 搭建的后端提供的 API 获取,后端用 pymysql 访问 MySQL 获取数据。写一个尽可能简单的 demo 实现这一套流程。
Solution
我们从 MySQL 中的数据开始一步步往前端搭建。为了尽可能降低耦合,我们假设,前端、后端、数据库放在三台不同的服务器上。在本示例中,数据库在外部服务器上,通过 SSH Tunnel 访问;前端和后端分别运行在本机的 8080 和 5000 端口。
https://github.com/mollnn/Bilibili-Visualization
(依赖根据报错提示安装一下吧……懒得写了)
数据库查询接口
为了偷懒,我们对数据库访问的过程做一些封装,使得输入数据库名和查询语句即可直接获取结果。
该部分代码来源于网络。
// connectorSSHMySQL.py

import pymysql
from sshtunnel import SSHTunnelForwarder


def SSHMysql(DB, SQL):
    server = SSHTunnelForwarder(
        ssh_address_or_host=('?.?.com', 22),  # 指定ssh登录的跳转机的address
        ssh_username='?',  # 跳转机的用户
        ssh_password='?',  # 跳转机的密码
        local_bind_address=('127.0.0.1', 1268),  # 映射到本机的地址和端口
        remote_bind_address=('localhost', 3306))  # 数据库的地址和端口
    server.start()  # 启用SSH
    db = pymysql.connect(
        host="127.0.0.1",  # 映射地址local_bind_address IP
        port=1268,  # 映射地址local_bind_address端口
        user="root",
        passwd="?",
        database=DB,
        charset='utf8')
    cursor = db.cursor()
    cursor.execute(SQL.encode('utf8'))
    data = cursor.fetchall()
    cursor.close()
    return data


def query(DB, SQL):
    return SSHMysql(DB, SQL)


if __name__ == "__main__":
    SQL = "SELECT * FROM Danmu;"
    SelectResult = SSHMysql('bilibili', SQL)
    print(SelectResult)
Flask 后端
后端的任务主要是返回 JSON 格式的数据。这里没有引入带参数的查询。提供了两个 API 接口,一个从数据库中拉取,一个直接硬编码数据。用于不同情况的测试。
// app.py

from flask import Flask, jsonify, render_template
from flask.helpers import make_response
import connectorSSHMySQL as msql
from flask_cors import CORS

app = Flask(__name__)
CORS(app, resources=r'/*')


@app.route('/api/demo/')
def api_demo():
    return jsonify(msql.query("bilibili", "select view, danmaku from Vinfo;"))


@app.route('/api/test/')
def api_test():
    ans = jsonify({
        "product": [5, 20, 36, 10, 10, 20]
    })
    return make_response(ans)


if __name__ == '__main__':
    app.run(debug=True)
echarts 图表组件
创建组件,其名为 chart1,从官网上抄个 option,加上从后端接口拉数据的 vue-resource 操作。注意 get 路径一定要加 http://,同时尽量设置一下 header,毕竟是跨域请求。
// chart1.vue

<template>
  <div>
    <div id="echartContainer" style=" 100%; height: 500px"></div>
  </div>
</template>

<script>
export default {
  name: "chart1",
  data() {
    return {};
  },
  methods: {
    draw() {
      var myChart = this.$echarts.init(
        document.getElementById("echartContainer"),
        "infographic"
      );
      myChart.setOption({
        xAxis: {},
        yAxis: {},
        series: [
          {
            symbolSize: 5,
            data: [],
            type: "scatter",
          },
        ],
      });
      this.$http
        .get("http://localhost:5000/api/demo/", {
          headers: { "Access-Control-Allow-Origin": "*" },
        })
        .then((res) => {
          myChart.hideLoading();
          myChart.setOption({ series: [{ data: res.data }] });
        });
    },
  },
  mounted() {
    this.draw();
  },
};
</script>

<style></style>
Vue.js 前端
把各种东西在 main.js 中引入一下,并在 app 中注册和创建一个 chart1。
// main.js

import Vue from 'vue'
import App from './App.vue'
import VueResource from 'vue-resource'
import * as VueJsonp from 'vue-jsonp'
import echarts from 'echarts'

Vue.use(VueJsonp)
Vue.use(VueResource)
Vue.prototype.$echarts = echarts

new Vue({
    el: '#app',
    render: h => h(App)
})
// App.vue

<template>
  <div class="main">
    <chart1 />
  </div>
</template>
<script>
import chart1 from "./components/chart1.vue";

export default {
  components: {
    chart1,
  },
};
</script>
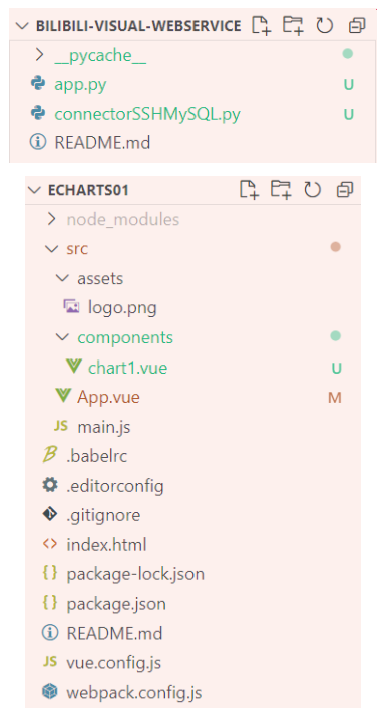
项目结构
测试
在后端根目录下
python app.py
在前端根目录下
npm run dev
浏览器访问 localhost:8080,看到这么个图

这反映的是 B 站部分视频的弹幕数量和播放量的关系。
魔改指南
后端加 API 直接添路由改 SQL 即可。
前端加图,从 echarts 官网拿 option 改改,把 option 的 JSON 直接贴到 myChart.setOption(...) 中,修改 this.$http.get("...",...)... 中 GET 的 URL。