自从上一次绘制雪花曲线(用javascript绘制雪花(Koch曲线))之后,对简单分形更加喜欢,太复杂的只能欣赏了,简单分形还是决定一个一个的用代码绘制出来,html5中的canvas标签相当方便,本文继续使用javascript + canvas的模式。
谢尔宾斯基三角形由波兰数学家谢尔宾斯基在1915年提出。详情见wiki。
总体上说来这个三角形比雪花曲线要来的简单,基本思路和雪花曲线类似,所以没有什么难度。
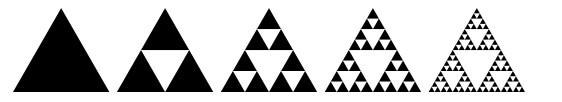
图1
图1为谢尔宾斯基三角形的变化规律,由于都是正三角形,所以几个点处理起来很方便。

图2
图2中我们约定了正三角形的三个点分别为P1、P2、P3,中心点的三个点为P4、P5、P6。我们约定:在方法调用的时候P2和P3在一条直线,X3大于X2。这样约定在递归方法中会比较容易处理。
首先是body代码,加入canvas标签。并加入适当样式。
<style>
canvas{border:2px solid #000; background:#fff;}
</style>
<body onload="draw()">
<input type="text" value="1" id="txtDepth"/>
<input type="button" value="绘制" onclick="draw()"/>
<input type="checkbox" id="cbox">彩色
<br />
<canvas id="cantest" width="500px" height="500px"></canvas>
</body>
canvas{border:2px solid #000; background:#fff;}
</style>
<body onload="draw()">
<input type="text" value="1" id="txtDepth"/>
<input type="button" value="绘制" onclick="draw()"/>
<input type="checkbox" id="cbox">彩色
<br />
<canvas id="cantest" width="500px" height="500px"></canvas>
</body>
主要代码:
<script language="javascript">
function draw(){
var can = document.getElementById("cantest");
if(can.getContext){
can.height = can.height;
var ctx = can.getContext("2d");
ctx.strokeStyle = "#000";
var depth = parseInt(document.getElementById("txtDepth").value); //绘制维度
Sierpinski(ctx, 250.00, 20.00, 0.00, 500 * Math.sin(Math.PI / 3) + 20, 500.00,500 * Math.sin(Math.PI / 3) + 20, depth , 0);
}else{
alert("不支持Canvas");
}
}
if(depth == 0){
return false;
}
if(depth == nowDepth){
ctx.beginPath();
if(document.getElementById("cbox").checked){
ctx.fillStyle = getColor();
}else{
ctx.fillStyle = "#000";
}
ctx.moveTo(x1, y1);
ctx.lineTo(x2, y2);
ctx.lineTo(x3, y3);
ctx.fill(); //填充块
return false;
}
var x4 = x2 + (x3 - x2) / 2;
var x5 = x2 + (x3 - x2) / 4;
var x6 = x2 + (x3 - x2) * 3 / 4;
var y4 = 0.00;
var y5 = 0.00;
var y6 = 0.00;
y4 = y1 + (x3 - x2) * Math.sin(Math.PI / 3);
y5 = y1 + (x3 - x2) / 2 * Math.sin(Math.PI / 3);
y6 = y1 + (x3 - x2) / 2 * Math.sin(Math.PI / 3);
Sierpinski(ctx, x1, y1, x5, y5, x6, y6, depth, nowDepth);
Sierpinski(ctx, x5, y5, x2, y2, x4, y4, depth, nowDepth);
Sierpinski(ctx, x6, y6, x4, y4, x3, y3, depth, nowDepth);
}
function getColor(){
return '#'+(Math.random()*0xffffff<<0).toString(16);
}
</script>
function draw(){
var can = document.getElementById("cantest");
if(can.getContext){
can.height = can.height;
var ctx = can.getContext("2d");
ctx.strokeStyle = "#000";
var depth = parseInt(document.getElementById("txtDepth").value); //绘制维度
Sierpinski(ctx, 250.00, 20.00, 0.00, 500 * Math.sin(Math.PI / 3) + 20, 500.00,500 * Math.sin(Math.PI / 3) + 20, depth , 0);
}else{
alert("不支持Canvas");
}
}
function Sierpinski(ctx, x1, y1,
x2, y2,
x3, y3,
depth, //维度
nowDepth){ //当前维度
nowDepth = nowDepth + 1;if(depth == 0){
return false;
}
if(depth == nowDepth){
ctx.beginPath();
if(document.getElementById("cbox").checked){
ctx.fillStyle = getColor();
}else{
ctx.fillStyle = "#000";
}
ctx.moveTo(x1, y1);
ctx.lineTo(x2, y2);
ctx.lineTo(x3, y3);
ctx.fill(); //填充块
return false;
}
var x4 = x2 + (x3 - x2) / 2;
var x5 = x2 + (x3 - x2) / 4;
var x6 = x2 + (x3 - x2) * 3 / 4;
var y4 = 0.00;
var y5 = 0.00;
var y6 = 0.00;
y4 = y1 + (x3 - x2) * Math.sin(Math.PI / 3);
y5 = y1 + (x3 - x2) / 2 * Math.sin(Math.PI / 3);
y6 = y1 + (x3 - x2) / 2 * Math.sin(Math.PI / 3);
Sierpinski(ctx, x1, y1, x5, y5, x6, y6, depth, nowDepth);
Sierpinski(ctx, x5, y5, x2, y2, x4, y4, depth, nowDepth);
Sierpinski(ctx, x6, y6, x4, y4, x3, y3, depth, nowDepth);
}
function getColor(){
return '#'+(Math.random()*0xffffff<<0).toString(16);
}
</script>
运行后效果如下:

图3 黑白

图4 彩色
这次其实用画线的方法也是可以得,只是上次用过了,下次看到好玩的分形,继续玩一玩,canvas标签功能着实强大,应该好好发掘。