最近在项目中用到了google的heap profiler工具来分析内存占用,效果非常显著,因此在这里写一篇博客记录一下使用过程中遇到的一些问题。
heap profiler依赖于tcmalloc,所以先要在本机安装tcmalloc,安装过程非常的简单。然后开始使用tcmalloc进行编译自己写的程序。
- 生成堆栈快照
先写一段申请大量内存的代码:
heap_profiler.cpp
  1 #include <iostream>
  2 #include <unistd.h>
  3
  4 int* create(unsigned int size)
  5 {
  6     return new int[size];
  7 }
  8
  9 int main()
 10 {
 11     int count = 10;
 12     int* array[count];
 13
 14     unsigned int size = 1024 * 1024;
 15     for (int i = 0; i < count; ++i) {
 16         sleep(1);
 17         array[i] = create(10 * size);
 18
 19         int* b = new int[2 * size];
 20     }
 21
 22     for (int i = 0; i < count; ++i) {
 23         delete[] array[i];
 24     }
 25 }
接着进行编译:
$ g++ heap_profiler.cpp -ltcmalloc -g -o main
然后执行如下命令:
$ HEAPPROFILE=test ./main
Starting tracking the heap
Dumping heap profile to test.0001.heap (136 MB currently in use)
Dumping heap profile to test.0002.heap (240 MB currently in use)
Dumping heap profile to test.0003.heap (376 MB currently in use)
Dumping heap profile to test.0004.heap (480 MB currently in use)
Dumping heap profile to test.0005.heap (Exiting, 80 MB in use)
$ ls
heap_profiler.cpp  main  test.0001.heap  test.0002.heap  test.0003.heap  test.0004.heap  test.0005.heap
可以看到,这里生成了几个.heap文件,并且知道程序退出时,还有80M的内存在未释放。使用pprof命令即可对这些文件进行分析。
这里需要特别注意一点,笔者之前因为项目本身用的tcmalloc是采用静态链接方式,即如下所示,编译时,静态链接了static_lib下的libtcmalloc.a:
$ ls -lh
total 8.0K
-rw-rw-r-- 1 minglee minglee  279 Dec 15 16:42 heap_profiler.cpp
drwxrwxr-x 2 minglee minglee 4.0K Dec 15 17:06 static_lib

$ ls -lh static_lib/
total 5.7M
-rw-rw-r-- 1 minglee minglee 5.6M Dec 15 17:03 libtcmalloc.a

$ g++ heap_profiler.cpp -ltcmalloc -g -o main -Lstatic_lib/ -lpthread
static_lib//libtcmalloc.a(stacktrace.o): In function `GetStackTraceWithContext_libunwind(void**, int, int, void const*)':
/home/minglee/install_packet/gperftools-2.7/src/stacktrace_libunwind-inl.h:112: undefined reference to `_Ux86_64_getcontext'
/home/minglee/install_packet/gperftools-2.7/src/stacktrace_libunwind-inl.h:116: undefined reference to `_ULx86_64_init_local'
/home/minglee/install_packet/gperftools-2.7/src/stacktrace_libunwind-inl.h:120: undefined reference to `_ULx86_64_step'
/home/minglee/install_packet/gperftools-2.7/src/stacktrace_libunwind-inl.h:138: undefined reference to `_ULx86_64_step'
/home/minglee/install_packet/gperftools-2.7/src/stacktrace_libunwind-inl.h:131: undefined reference to `_ULx86_64_get_reg'
static_lib//libtcmalloc.a(stacktrace.o): In function `GetStackTrace_libunwind(void**, int, int)':
/home/minglee/install_packet/gperftools-2.7/src/stacktrace_libunwind-inl.h:112: undefined reference to `_Ux86_64_getcontext'
/home/minglee/install_packet/gperftools-2.7/src/stacktrace_libunwind-inl.h:116: undefined reference to `_ULx86_64_init_local'
/home/minglee/install_packet/gperftools-2.7/src/stacktrace_libunwind-inl.h:120: undefined reference to `_ULx86_64_step'
/home/minglee/install_packet/gperftools-2.7/src/stacktrace_libunwind-inl.h:138: undefined reference to `_ULx86_64_step'
/home/minglee/install_packet/gperftools-2.7/src/stacktrace_libunwind-inl.h:131: undefined reference to `_ULx86_64_get_reg'
static_lib//libtcmalloc.a(stacktrace.o): In function `GetStackFramesWithContext_libunwind(void**, int*, int, int, void const*)':
/home/minglee/install_packet/gperftools-2.7/src/stacktrace_libunwind-inl.h:112: undefined reference to `_Ux86_64_getcontext'
/home/minglee/install_packet/gperftools-2.7/src/stacktrace_libunwind-inl.h:116: undefined reference to `_ULx86_64_init_local'
/home/minglee/install_packet/gperftools-2.7/src/stacktrace_libunwind-inl.h:120: undefined reference to `_ULx86_64_step'
/home/minglee/install_packet/gperftools-2.7/src/stacktrace_libunwind-inl.h:124: undefined reference to `_ULx86_64_get_reg'
/home/minglee/install_packet/gperftools-2.7/src/stacktrace_libunwind-inl.h:138: undefined reference to `_ULx86_64_step'
/home/minglee/install_packet/gperftools-2.7/src/stacktrace_libunwind-inl.h:143: undefined reference to `_ULx86_64_get_reg'
/home/minglee/install_packet/gperftools-2.7/src/stacktrace_libunwind-inl.h:131: undefined reference to `_ULx86_64_get_reg'
static_lib//libtcmalloc.a(stacktrace.o): In function `GetStackFrames_libunwind(void**, int*, int, int)':
/home/minglee/install_packet/gperftools-2.7/src/stacktrace_libunwind-inl.h:112: undefined reference to `_Ux86_64_getcontext'
/home/minglee/install_packet/gperftools-2.7/src/stacktrace_libunwind-inl.h:116: undefined reference to `_ULx86_64_init_local'
/home/minglee/install_packet/gperftools-2.7/src/stacktrace_libunwind-inl.h:120: undefined reference to `_ULx86_64_step'
/home/minglee/install_packet/gperftools-2.7/src/stacktrace_libunwind-inl.h:124: undefined reference to `_ULx86_64_get_reg'
/home/minglee/install_packet/gperftools-2.7/src/stacktrace_libunwind-inl.h:138: undefined reference to `_ULx86_64_step'
/home/minglee/install_packet/gperftools-2.7/src/stacktrace_libunwind-inl.h:143: undefined reference to `_ULx86_64_get_reg'
/home/minglee/install_packet/gperftools-2.7/src/stacktrace_libunwind-inl.h:131: undefined reference to `_ULx86_64_get_reg'
collect2: error: ld returned 1 exit status

$ g++ heap_profiler.cpp -ltcmalloc -g -o main -Lstatic_lib/ -lpthread -lunwind

$ HEAPPROFILE=test ./main
$
导致执行的时候没有任何的反应,也不会出现 “Starting tracking the heap” 提示,更不会生成 .heap 文件。所以切记使用heap_profiler的时候需要使用动态链接,如果不想使用动态链接,也可以通过加代码的方式去生成.heap文件:
  1 #include <iostream>
  2 #include <unistd.h>
  3 #include <gperftools/heap-profiler.h>
  4
  5 int* create(unsigned int size)
  6 {
  7     return new int[size];
  8 }
  9
 10 int main()
 11 {
 12     HeapProfilerStart("test");
 13     int count = 10;
 14     int* array[count];
 15
 16     unsigned int size = 1024 * 1024 * 10;
 17     for (int i = 0; i < count; ++i) {
 18         sleep(1);
 19         array[i] = create(size);
 20
 21         int* b = new int[2 * size];
 22     }
 23
 24     for (int i = 0; i < count; ++i) {
 25         delete[] array[i];
 26     }
 27     HeapProfilerStop();
 28 }
注意 第12行 和 第27行 增加的两个函数,HeapProfilerStart() 和 HeapProfilerStop()(头文件在<gperftools/heap-profiler.h>中),分别用来开启和关闭堆栈分析器,HeapProfilerStart() 需要一个参数,这个参数就是.heap文件(也就是堆栈快照)的前缀。这个前缀也可以通过环境变量 HEAPPROFILE 来设置。这也编译出来的代码,直接执行,也可以生产.heap文件:
$ g++ heap_profiler.cpp -ltcmalloc -g -o main -Lstatic_lib/ -lpthread -lunwind
$ ./main
Starting tracking the heap
Dumping heap profile to test.0001.heap (136 MB currently in use)
Dumping heap profile to test.0002.heap (240 MB currently in use)
Dumping heap profile to test.0003.heap (376 MB currently in use)
Dumping heap profile to test.0004.heap (480 MB currently in use)
可以看到,使用动态编译的方式libtcmalloc的方式来使用heap profiler能显示出更多的信息,比如程序退出时是否有未释放的内存。以下的分析阶段都是采用动态编译的方式进行。
- 使用pprof命令进行分析:
$ HEAPPROFILE=test ./main
Starting tracking the heap
Dumping heap profile to test.0001.heap (136 MB currently in use)
Dumping heap profile to test.0002.heap (240 MB currently in use)
Dumping heap profile to test.0003.heap (376 MB currently in use)
Dumping heap profile to test.0004.heap (480 MB currently in use)
Dumping heap profile to test.0005.heap (Exiting, 80 MB in use)

$ pprof --text main test.0004.heap
Using local file main.
Using local file test.0004.heap.
Total: 480.0 MB
   400.0  83.3%  83.3%    400.0  83.3% create
    80.0  16.7% 100.0%    480.0 100.0% main
     0.0   0.0% 100.0%    480.0 100.0% __libc_start_main
可以很清晰的看到内存分配的函数以及分配的内存总量。各列含义的解读:
- 第一列包含直接占用的内存
- 第四列包含自身和所有被调用的函数占用的内存
- 第二列和第五列仅仅是第一列和第四列数字的百分比表示
- 第三列是第二列从第一行到当前行的累加值。(比如:二行三列= 一行二列 + 二行二列; 三行三列 = 一行二列 + 二行二列 + 三行二列)
另外还可以加上--stack选项(与--text同时使用):
$ pprof --text --stack main test.0004.heap
Using local file main.
Using local file test.0004.heap.
Total: 480.0 MB
Stacks:

83886080 (00000000004009aa) /home/minglee/workspace/test_code/heap_profiler/heap_profiler.cpp:19:main
         (00007f9644cb3c04) ??:0:__libc_start_main

419430400 (00000000004008b8) /home/minglee/workspace/test_code/heap_profiler/heap_profiler.cpp:7:create
         (000000000040096d) /home/minglee/workspace/test_code/heap_profiler/heap_profiler.cpp:17:main
         (00007f9644cb3c04) ??:0:__libc_start_main

Leak of 419430400 bytes in 10 objects allocated from:
    @ 004008b8 unknown
    @ 000000000040096d main /home/minglee/workspace/test_code/heap_profiler/heap_profiler.cpp:17
    @ 00007f9644cb3c04 __libc_start_main ??:0
Leak of 83886080 bytes in 10 objects allocated from:
    @ 004009aa unknown
    @ 00007f9644cb3c04 __libc_start_main ??:0

   400.0  83.3%  83.3%    400.0  83.3% create
    80.0  16.7% 100.0%    480.0 100.0% main
     0.0   0.0% 100.0%    480.0 100.0% __libc_start_main
--text的选项,在查看简单的程序时还是不错的,但是面对复杂的程序时,就显得心有余力不足了。这个时候可以使用--gv选项:
$ pprof --gv main test.0004.heap
Using local file main.
Using local file test.0004.heap.
Dropping nodes with <= 2.4 MB; edges with <= 0.5 abs(MB)
sh: dot: command not found
这里报错是因为--gv选项需要安装 graphviz 和 gv:
$ sudo yum install graphviz gv
安装完之后如果报出如下错误:
$ pprof --gv main test.0004.heap
Using local file main.
Using local file test.0004.heap.
Dropping nodes with <= 2.4 MB; edges with <= 0.5 abs(MB)
gv: Unable to open the display.
说明无法打开显示器,也就是说,--gv选项,需要在带图形界面的系统上使用。转到图形界面系统上做分析,可以得到下图:
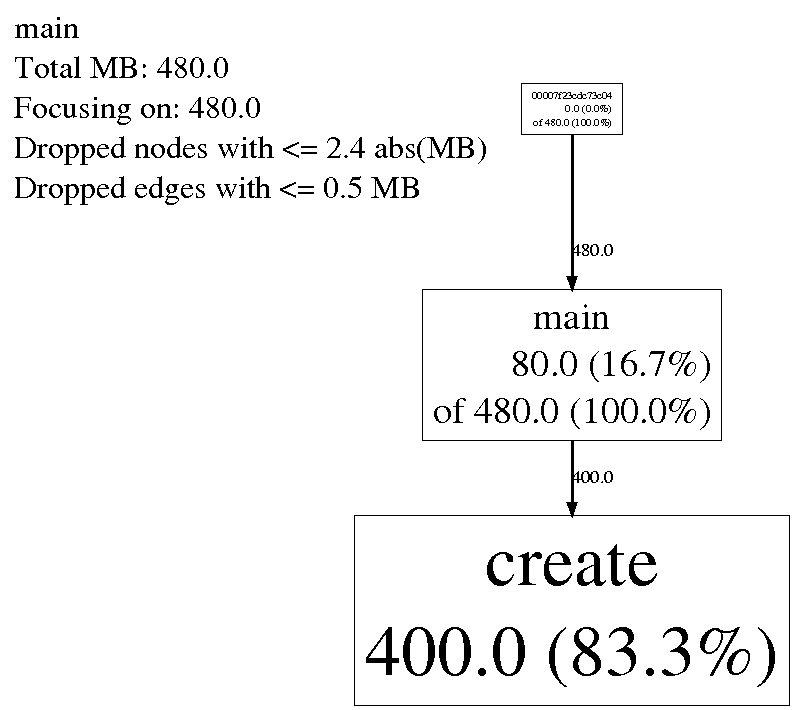
可以看到main函数占用了80M内存,占所有占用内存的16.7%,main直接或间接占用了内存480M,占所有未释放内存的100%,下面的create函数占用内存400M,占所有未释放内存的83.3%。显示的结果非常清晰明了,能够清晰的定位到问题。
此外,为了生成明确的堆栈,编译优化建议不要开,O0就好,最好再加上编译选项 -fno-omit-frame-pointer 这样能更好的显示出完整堆栈,定位起问题来会更加的轻松。