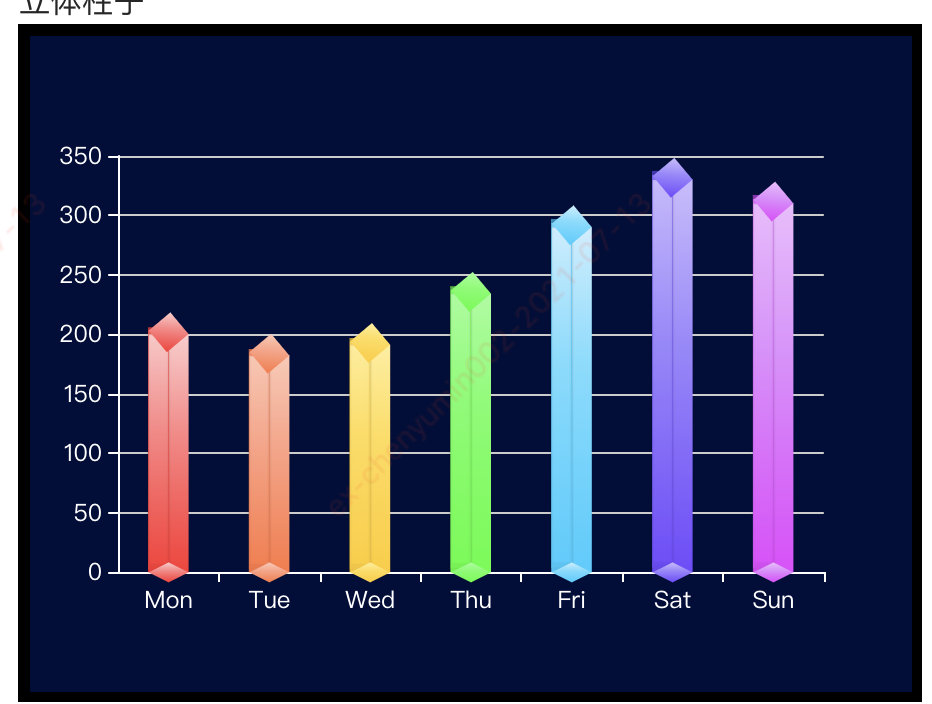
一、图例

二、记录点
1、二维坐标+立体柱子
2、立体柱子设计:除了主要呈现的数据平面柱使用了bar类型,其他三面采用象形柱图pictorialBar类型构建。也可以通过数据柱状图加上下两个象形柱图使之呈现视觉上的立体效果。
3、通过silent: true限制象形柱图的事件相应效果。
4、symbol设置图形类型;symbolOffset设置图形的位置;symbolSize设置图形的大小;symbolPosition是图形的定位位置。
5、注释的label是文本显示。
三、完整代码
import React, { Component } from 'react';
import * as echarts from 'echarts';
import '../../stylus/charts/charts-com.less';
interface Props {}
type StateType = {
    dataList: number[],
    dataArray: any
    dataArray2: any
}
class CubeBar3 extends Component<Props, StateType> {
    constructor(props) {
        super(props);
        this.state = {
            dataList: [200,182, 191, 234, 290, 330, 310],
            dataArray: [],
            dataArray2: [],
        }
    }
    componentWillMount() {
        // 渲染前
        let color1 = ['#FF3333', '#FF7744', '#FFCC22', '#33FF33','#33CCFF', '#7744FF','#E93EFF'],
        color2 = ['#FF8888', '#FFA488', '#FFDD55', '#66FF66', '#77DDFF', '#9F88FF', '#E38EFF'],
        color3 = ['#FFCCCC', '#FFC8B4', '#FFEE99', '#99FF99', '#CCEEFF', '#CCBBFF', '#F0BBFF'];
        console.log('Component WILL MOUNT!');
        let aar = [], aar2 = [];
        this.state.dataList.map((item, index) => {
            let obj = {
                value: item,
                itemStyle: {
                    color: new echarts.graphic.LinearGradient(0, 1, 0, 0, [{
                        offset: 0,
                        color: color1[index] // 0% 处的颜色
                    }, {
                        offset: 0.6,
                        color: color2[index] // 60% 处的颜色
                    }, {
                        offset: 1,
                        color: color3[index] // 100% 处的颜色
                    }], false),

                }
            };
            aar.push(Object.assign({}, obj))
        });
        this.state.dataList.map((item, index) => {
            let obj = {
                value: item,
                itemStyle: {
                    color: new echarts.graphic.LinearGradient(0, 1, 0, 0, [{
                        offset: 0,
                        color: color1[index] // 0% 处的颜色
                    }, {
                        offset: 0.6,
                        color: color2[index] // 60% 处的颜色
                    }, {
                        offset: 1,
                        color: color3[index] // 100% 处的颜色
                    }], false),
                    borderWidth: 1,
                    borderColor: color1[index],
                    shadowColor: 'rgba(0, 0, 0, 0.2)',
                    shadowBlur: 1,
                }
            };
            aar2.push(Object.assign({}, obj))
        });
        this.setState({
            dataArray: aar,
            dataArray2: aar2
        });
    }
    componentDidMount() {
        // 渲染后
        console.log('ccccccccc', this.state.dataArray);
        let barWidth = 800 / 40;
        let option = {
            backgroundColor: '#010d3a',
            xAxis: {
                type: 'category',
                data: ['Mon', 'Tue', 'Wed', 'Thu', 'Fri', 'Sat', 'Sun'],
                axisLine: {
                    lineStyle: {
                        color: '#fff'
                    }
                }
            },
            yAxis: {
                type: 'value',
                axisLine: {
                    lineStyle: {
                        color: '#fff'
                    }
                }
            },
            tooltip:{
                show: true,
                orient: 'vertical',
                formatter: '{b0}: {c0}'
            },
            series: [
                {
                    type: 'bar',
                    barWidth: barWidth,
                    z: 1,
                    // label: {
                    //     show: true,
                    //     position: 'top',
                    //     padding: [0, 0, 0, 10],
                    //     formatter: '{b}: {c}',
                    //     color: '#fff'
                    // },
                    data: this.state.dataArray
                },
                {
                    z: 1,
                    type: 'pictorialBar',
                    barWidth: barWidth / 2,
                    symbol: 'rect',
                    symbolOffset: ['50%', 0],
                    symbolRepea: false,
                    data: this.state.dataArray2,
                    silent: true
                },
                {
                    z: 3,
                    type: 'pictorialBar',
                    symbolPosition: 'start',
                    data: this.state.dataArray,
                    symbol: 'diamond',
                    symbolOffset: [0, '55%'],
                    symbolSize: [barWidth, barWidth * 0.5],
                    silent: true
                },
                {
                    z: 3,
                    type: 'pictorialBar',
                    symbolPosition: 'end',
                    data: this.state.dataArray,
                    symbol: 'diamond',
                    symbolOffset: [0, '-55%'],
                    symbolSize: [barWidth, barWidth * 0.5],
                    silent: true
                }
            ]
        };
        let myChart = echarts.init(document.getElementById('canvasBox'));
        myChart.setOption(option);
        window.addEventListener("resize", myChart.resize);
    }
    render() {
        return (
            <div>
                <div className="cube-bar">
                    <h1>立体柱子</h1>
                    <div className="chart-area">
                        <div id="canvasBox" className='canvasBox'></div>
                    </div>
                </div>
            </div>
        );
    }
}
export default CubeBar3;