1 MongoDB 在 Django中的配置方法
1.1 全局配置
- settings中定义,和Mysql不冲突,但是在可视化工具中发现,数据库名字会多很多个下划线
1.1.1 settings.py
DATABASES = {
    'default': {
        'ENGINE': 'django.db.backends.mysql',
        'NAME': 'gogogo_db',
        'USER': 'root',
        'PASSWORD': '1594184',
        'HOST': '127.0.0.1',
        'PORT': '3306'
    },
    'gogogo_mongodb': {
        'ENGINE': None,
    }
}

import mongoengine
mongoengine.connect('gogogo_mongodb')   # 数据库名字
1.1.2 models.py
import mongoengine
class SharesWWeekKDB(mongoengine.Document):
    date = mongoengine.DateField()
    monday_start = mongoengine.DecimalField(max_digits=5, decimal_places=2)
    friday_end = mongoengine.DecimalField(max_digits=5, decimal_places=2)
    max = mongoengine.DecimalField(max_digits=5, decimal_places=2)
    min = mongoengine.DecimalField(max_digits=5, decimal_places=2)
    turnover = mongoengine.IntField(default=0)

    class Meta:
        db_table = 'sharesweekk'
1.2 局部配置
- views视图中加入
import pymongo
client = pymongo.MongoClient(host='localhost', port=27017)
db = client['gogogo_db']
set = db['shares']
set.insert(
            {
                'date':date,
                'monday_start': monday_start,
                'friday_end': friday_end,
                'max': max,
                'min': min,
                'turnover': turnover
            }
        )
2 Echarts + Vue
- 一种可视化工具,可以在前端实现不同的图哦~
- 安装方法
npm install echarts --save
- 配置全局
import echarts from 'echarts'
Vue.prototype.$echarts = echarts
2.1 扇形统计图
2.2.1 效果

2.2.2 代码实例
- vue
<template>
  <div class="analyzeSystem">
    <div :class="className" :id="id" :style="{height:height,width}" ref="myEchart"></div>
  </div>
</template>

<script>
import echarts from "echarts";
export default {
  name: "analyzeSystem",
  props: {
    className: {
      type: String,
      default: "yourClassName"
    },
    id: {
      type: String,
      default: "yourID"
    },
     {
      type: String,
      default: "500px"
    },
    height: {
      type: String,
      default: "500px"
    }
  },
  data() {
    return {
      chart: null
    };
  },
  mounted() {
    this.initChart();
  },
  beforeDestroy() {
    if (!this.chart) {
      return;
    }
    this.chart.dispose();
    this.chart = null;
  },
  methods: {
    initChart() {
      this.chart = echarts.init(this.$refs.myEchart);
      // 把配置和数据放这里
      this.chart.setOption({
        backgroundColor: "#2c343c",

        title: {
          text: "Customized Pie",
          left: "center",
          top: 20,
          textStyle: {
            color: "#ccc"
          }
        },

        tooltip: {
          trigger: "item",
          formatter: "{a} <br/>{b} : {c} ({d}%)"
        },

        visualMap: {
          show: false,
          min: 80,
          max: 600,
          inRange: {
            colorLightness: [0, 1]
          }
        },
        series: [
          {
            name: "访问来源",
            type: "pie",
            radius: "55%",
            center: ["50%", "50%"],
            data: [
              { value: 335, name: "直接访问" },
              { value: 310, name: "邮件营销" },
              { value: 274, name: "联盟广告" },
              { value: 235, name: "视频广告" },
              { value: 400, name: "搜索引擎" }
            ].sort(function(a, b) {
              return a.value - b.value;
            }),
            roseType: "radius",
            label: {
              normal: {
                textStyle: {
                  color: "rgba(255, 255, 255, 0.3)"
                }
              }
            },
            labelLine: {
              normal: {
                lineStyle: {
                  color: "rgba(255, 255, 255, 0.3)"
                },
                smooth: 0.2,
                length: 10,
                length2: 20
              }
            },
            itemStyle: {
              normal: {
                color: "#c23531",
                shadowBlur: 200,
                shadowColor: "rgba(0, 0, 0, 0.5)"
              }
            },

            animationType: "scale",
            animationEasing: "elasticOut",
            animationDelay: function(idx) {
              return Math.random() * 200;
            }
          }
        ]
      });
    }
  }
};
</script>

<style>

</style>
2.2 折线图
2.2.1 效果
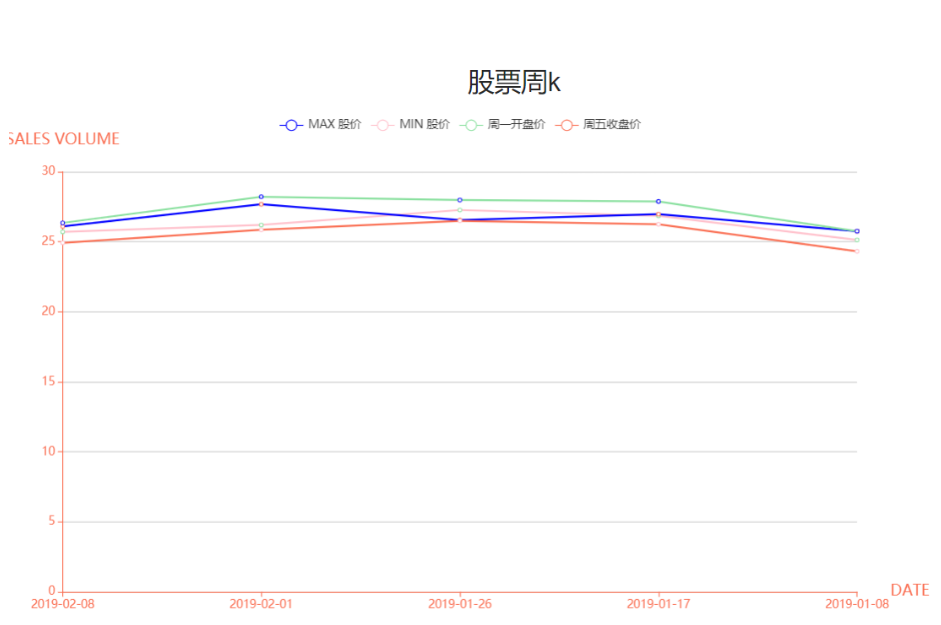
2.2.2 代码实例
- views.py
from rest_framework.response import Response
from rest_framework.views import APIView


class SharesWeekKView(APIView):
    def post(self, request):
        date = request.data.get('date')
        monday_start = request.data.get('monday_start')
        friday_end = request.data.get('friday_end')
        max = request.data.get('max')
        min = request.data.get('min')
        turnover = request.data.get('turnover')

        import pymongo
        client = pymongo.MongoClient(host='localhost', port=27017)
        db = client['gogogo_db']
        set = db['shares']
        set.insert(
            {
                'date':date,
                'monday_start': monday_start,
                'friday_end': friday_end,
                'max': max,
                'min': min,
                'turnover': turnover
            }
        )
        return Response('okok')

    def get(self, request):
        import pymongo
        client = pymongo.MongoClient(host='localhost', port=27017)
        db = client['gogogo_db']
        set = db['shares']
        list_mongodb = []
        for i in set.find():
            dic={}
            dic['date'] = i['date']
            dic['monday_start'] = i['monday_start']
            dic['friday_end'] = i['friday_end']
            dic['max'] = i['max']
            dic['min'] = i['min']
            dic['turnover'] = i['turnover']
            list_mongodb.append(dic)
        return Response({'data': list_mongodb, 'code': 200})
- ShareWeekK.vue
<template>
<div>
    <h1>股票周k</h1>
    <div id="chartLineBox" style=" 90%;height: 70vh;"> </div>
</div>

</template>

<script>
import echarts from "echarts";
import { get_share_week_k } from '@/http/apis'
export default {
  name: "analyzeSystem",
  data() {
    return {
      chart: null,
      shareList:[],
      dateList:[],
      maxList:[],
      minList:[],
      monMoney:[],
      fridayMoney:[]
    };
  },
    methods:{
        // getList(){
        //     get_share_week_k().then(res=>{
        //     console.log(res.data)
        //     this.shareList = res.data
        //         for(var i=0;i<this.shareList.length;i++){
        //             this.dateList.push(this.shareList[i]['date'])
        //             this.moneyList.push(this.shareList[i]['max'])
        //             this.numberList.push(this.shareList[i]['turnover'])
        //     }
        // })

        // }
    },
    mounted(){
        // this.getList()
        get_share_week_k().then(res=>{
            console.log(res.data)
            this.shareList = res.data
                for(var i=0;i<this.shareList.length;i++){
                    this.dateList.push(this.shareList[i]['date'])
                    this.maxList.push(this.shareList[i]['max'])
                    this.minList.push(this.shareList[i]['min'])
                    this.monMoney.push(this.shareList[i]['monday_start'])
                    this.fridayMoney.push(this.shareList[i]['friday_end'])
            }
            this.chartLine = echarts.init(document.getElementById('chartLineBox'));

        // 指定图表的配置项和数据
        var option = {
            tooltip: {              //设置tip提示
                trigger: 'axis'
            },

            legend: {               //设置区分(哪条线属于什么)
                data:['MAX 股价','MIN 股价', '周一开盘价', '周五收盘价']
            },
            color: ['#8AE09F', '#FA6F53', 'pink', 'blue'],       //设置区分(每条线是什么颜色,和 legend 一一对应)
            xAxis: {                //设置x轴
                type: 'category',
                boundaryGap: false,     //坐标轴两边不留白
                data: this.dateList,
                name: 'DATE',           //X轴 name
                nameTextStyle: {        //坐标轴名称的文字样式
                    color: '#FA6F53',
                    fontSize: 16,
                    padding: [0, 0, 0, 20]
                },
                axisLine: {             //坐标轴轴线相关设置。
                    lineStyle: {
                        color: '#FA6F53',
                    }
                }
            },
            yAxis: {
                name: 'SALES VOLUME',
                nameTextStyle: {
                    color: '#FA6F53',
                    fontSize: 16,
                    padding: [0, 0, 10, 0]
                },
                axisLine: {
                    lineStyle: {
                        color: '#FA6F53',
                    }
                },
                type: 'value'
            },
            series: [
              {
                name: '周一开盘价',
                data:  this.monMoney,
                type: 'line',               // 类型为折线图
                lineStyle: {                // 线条样式 => 必须使用normal属性
                    normal: {
                        color: 'pink',
                    }
                },
              },
               {
                name: '周五收盘价',
                data:  this.fridayMoney,
                type: 'line',               // 类型为折线图
                lineStyle: {                // 线条样式 => 必须使用normal属性
                    normal: {
                        color: 'blue',
                    }
                },
              },
              {
                name: 'MIN 股价',
                data: this.minList,
                type: 'line',
                lineStyle: {
                    normal: {
                        color: '#FA6F53',
                    }
                },
              },
              {
                name: 'MAX 股价',
                data:  this.maxList,
                type: 'line',               // 类型为折线图
                lineStyle: {                // 线条样式 => 必须使用normal属性
                    normal: {
                        color: '#8AE09F',
                    }
                },

              },
          ]
        };

        // 使用刚指定的配置项和数据显示图表。
        this.chartLine.setOption(option);
        })

    },
}
</script>

<style>

</style>
3 DWebSocket
- http 只能是前端请求后端,后端被动接受,ws 可以双向,视图中持久化连接,没有return
WebSocket是一种在单个TCP连接上进行全双工通信的协议
WebSocket使得客户端和服务器之间的数据交换变得更加简单,允许服务端主动向客户端推送数据。在WebSocket API中,浏览器和服务器只需要完成一次握手,两者之间就直接可以创建持久性的连接,并进行双向数据传输。
现在,很多网站为了实现推送技术,所用的技术都是轮询。轮询是在特定的的时间间隔(如每1秒),由浏览器对服务器发出HTTP请求,然后由服务器返回最新的数据给客户端的浏览器。这种传统的模式带来很明显的缺点,即浏览器需要不断的向服务器发出请求,然而HTTP请求可能包含较长的头部,其中真正有效的数据可能只是很小的一部分,显然这样会浪费很多的带宽等资源。
而比较新的技术去做轮询的效果是Comet。这种技术虽然可以双向通信,但依然需要反复发出请求。而且在Comet中,普遍采用的长链接,也会消耗服务器资源。
在这种情况下,HTML5定义了WebSocket协议,能更好的节省服务器资源和带宽,并且能够更实时地进行通讯数据库项目展示。
- django实现websocket大致上有两种方式,一种channels,一种是dwebsocket。channels依赖于redis,twisted等,相比之下使用dwebsocket要更为方便一些。
3.1 dwebsocket 安装和配置
3.1.1 安装
pip3 install dwebsocket
3.1.2 配置
INSTALLED_APPS = [
    .....
    .....
    'dwebsocket',
]
WEBSOCKET_ACCEPT_ALL=True   # 可以允许每一个单独的视图实用websockets
3.2 dwebsocket 方法
- request.is_websocket()
- 如果是个websocket请求返回True,如果是个普通的http请求返回False,可以用这个方法区分它们。
- request.websocket
- 在一个websocket请求建立之后,这个请求将会有一个websocket属性,用来给客户端提供一个简单的api通讯,如果request.is_websocket()是False,这个属性将是None。
- WebSocket.wait()
- 返回一个客户端发送的信息,在客户端关闭连接之前他不会返回任何值,这种情况下,方法将返回None
- WebSocket.read()
- 如果没有从客户端接收到新的消息,read方法会返回一个新的消息,如果没有,就不返回。这是一个替代wait的非阻塞方法
- WebSocket.count_messages()
- 返回消息队列数量
- WebSocket.has_messages()
- 如果有新消息返回True,否则返回False
- WebSocket.send(message)
- 向客户端发送消息
- WebSocket.
__iter__()- websocket迭代器
4 dwebsocket + django + mongodb + echarts 实现实时数据更新
4.1 参考代码
4.1.1 vue代码
<template>
  <a-layout id="components-layout-demo-custom-trigger">
    <a-layout-sider v-model="collapsed" :trigger="null" collapsible>
      <div class="logo" />

      <leftmenu :menu_number='2' />

    </a-layout-sider>
    <a-layout>
      <a-layout-header style="background: #fff; padding: 0">

        <a-icon
          class="trigger"
          :type="collapsed ? 'menu-unfold' : 'menu-fold'"
          @click="() => (collapsed = !collapsed)"
        />

        <div style="float:right">123123</div>


      </a-layout-header>

      <a-layout-content
        :style="{ margin: '24px 16px', padding: '24px', background: '#fff', minHeight: '500px' }">


        <div v-for="item in msglist" :key="item.id">

          {{ item }}

        </div>


        <a-button type="primary" @click="openbox">咨询客服</a-button>


        <a-modal v-model="show" @ok="myok">

            <p>客服:说了什么</p>
            <p>客户:说了什么</p>

        </a-modal>


      </a-layout-content>
    </a-layout>
  </a-layout>

</template>


<script>

//导入组件
// import leftmenu from './leftmenu.vue';


export default {
  data () {
    return {
      show:false,
      //聊天记录
      msglist:[],
      msg: "这是一个变量",
      collapsed: false,
      //列
      columns:[
        {title:"uid",dataIndex:"uid"},
        {title:"username",dataIndex:"username"},
        //指定操作列
        {title:'operation',dataIndex:'operation',
        scopedSlots:{customRender:'operation'}
        }
      ],
      //数据
      dataSource:[
        {key:'1',uid:1,username:"小红"},
        {key:'2',uid:2,username:"小王"}
      ]

    }
  },
  mounted:function(){

    var _this = this;

    //判断浏览器是否支持websocket
    if("WebSocket" in window){

       console.log("支持");
       //生成websocket链接
       var ws = new WebSocket("ws://localhost:1594/shares/websocketlink/");

       //发送链接请求
       ws.onopen = function(){

          ws.send("test");


       }

       //发送消息
       ws.onmessage = function(evt){

          //将获取信息打印
          var received_msg = evt.data;

          alert(received_msg);
          _this.msglist.push(received_msg);

       }

       //捕获断开链接
       ws.onclose = function(){

          console.log("链接已经关闭");
       }


    }


},
  methods:{
    myok:function(){

        this.show = false;
    },
    openbox:function(){
        this.show = true;
    },
    //删除操作
    onDelete(key) {
      console.log(key);
    }

  }
}


</script>

<style scoped>

#components-layout-demo-custom-trigger .trigger {
  font-size: 18px;
  line-height: 64px;
  padding: 0 24px;
  cursor: pointer;
  transition: color 0.3s;
}

#components-layout-demo-custom-trigger .trigger:hover {
  color: #1890ff;
}

#components-layout-demo-custom-trigger .logo {
  height: 32px;
  background: rgba(255, 255, 255, 0.2);
  margin: 16px;
}

</style>
4.1.1 views代码
from dwebsocket.decorators import accept_websocket #引入dwbsocket的accept_websocket装饰器

clients={} #创建客户端列表,存储所有在线客户端

# 允许接受ws请求

import uuid

#websocket接口
#客户端列表
@accept_websocket
def websocketlink(request):

	if request.is_websocket():

		userid = str(uuid.uuid1())

		while True:

			message = request.websocket.wait()

			if not message:
				break
			else:
				print('websocket链接成功'+str(message))
				clients[userid] = request.websocket
4.2 Django端
4.2.1 urls.py
from django.urls import path
from django.conf.urls import url

from sharesapp import views
from sharesapp.utils import websocketlink

urlpatterns = [
    path('shares_add/', views.SharesWeekKView.as_view()),
    path('websocketlink/', websocketlink)
]
4.2.2 utils.py
from dwebsocket.decorators import accept_websocket # 引入dwbsocket的accept_websocket装饰器

clients={} # 创建客户端列表,存储所有在线客户端

# 允许接受ws请求

import uuid

# websocket接口
# 客户端列表

@accept_websocket
def websocketlink(request):
    if request.is_websocket():
        while True:
            # message = request.websocket.wait()
            # import time
            # time.sleep(10)
            # if not message:
            #     break
            # else:
                import pymongo
                client = pymongo.MongoClient(host='localhost', port=27017)
                db = client['gogogo_db']
                set = db['shares']
                list_mongodb = []
                for i in set.find():
                    dic = {}
                    dic['date'] = i['date']
                    dic['monday_start'] = i['monday_start']
                    dic['friday_end'] = i['friday_end']
                    dic['max'] = i['max']
                    dic['min'] = i['min']
                    dic['turnover'] = i['turnover']
                    list_mongodb.append(dic)
                print(list_mongodb)
                import json
                request.websocket.send(json.dumps(list_mongodb))
                import time
                time.sleep(10)
4.3 Vue端
- DwebSocket.vue
<template>
    <div>
        <h1>股票周k</h1>
        <div id="chartLineBox" style=" 90%;height: 70vh;"> </div>
    </div>

</template>

<script>
import echarts from "echarts";
import { get_share_week_k } from '@/http/apis'
export default {
  data () {
    return {
      shareList:[],
      dateList:[],
      maxList:[],
      minList:[],
      monMoney:[],
      fridayMoney:[],
    }
  },
  mounted:function(){

    var _this = this;

    //判断浏览器是否支持websocket
    if("WebSocket" in window){

       console.log("支持");
       //生成websocket链接
       var ws = new WebSocket("ws://localhost:1594/shares/websocketlink/");

       //发送链接请求
       ws.onopen = function(e){
          ws.send("发送数据");
       }

       //发送消息
       ws.onmessage = function(evt){

          //将获取信息打印
          this.shareList = JSON.parse(evt.data)
          console.log(JSON.parse(evt.data))
          // this.getList()
        //   ws.send(123)
       }
       this.getList()
       //捕获断开链接
       ws.onclose = function(){
          console.log("链接已经关闭");
       }

    }
},
  methods:{
      getList(){
            get_share_week_k().then(res=>{
            console.log(res.data)
            this.shareList = res.data
                for(var i=0;i<this.shareList.length;i++){
                    this.dateList.push(this.shareList[i]['date'])
                    this.maxList.push(this.shareList[i]['max'])
                    this.minList.push(this.shareList[i]['min'])
                    this.monMoney.push(this.shareList[i]['monday_start'])
                    this.fridayMoney.push(this.shareList[i]['friday_end'])
            }
            this.chartLine = echarts.init(document.getElementById('chartLineBox'));

        // 指定图表的配置项和数据
        var option = {
            tooltip: {              //设置tip提示
                trigger: 'axis'
            },

            legend: {               //设置区分(哪条线属于什么)
                data:['MAX 股价','MIN 股价', '周一开盘价', '周五收盘价']
            },
            color: ['#8AE09F', '#FA6F53', 'pink', 'blue'],       //设置区分(每条线是什么颜色,和 legend 一一对应)
            xAxis: {                //设置x轴
                type: 'category',
                boundaryGap: false,     //坐标轴两边不留白
                data: this.dateList,
                name: 'DATE',           //X轴 name
                nameTextStyle: {        //坐标轴名称的文字样式
                    color: '#FA6F53',
                    fontSize: 16,
                    padding: [0, 0, 0, 20]
                },
                axisLine: {             //坐标轴轴线相关设置。
                    lineStyle: {
                        color: '#FA6F53',
                    }
                }
            },
            yAxis: {
                name: 'SALES VOLUME',
                nameTextStyle: {
                    color: '#FA6F53',
                    fontSize: 16,
                    padding: [0, 0, 10, 0]
                },
                axisLine: {
                    lineStyle: {
                        color: '#FA6F53',
                    }
                },
                type: 'value'
            },
            series: [
              {
                name: '周一开盘价',
                data:  this.monMoney,
                type: 'line',               // 类型为折线图
                lineStyle: {                // 线条样式 => 必须使用normal属性
                    normal: {
                        color: 'pink',
                    }
                },
              },
               {
                name: '周五收盘价',
                data:  this.fridayMoney,
                type: 'line',               // 类型为折线图
                lineStyle: {                // 线条样式 => 必须使用normal属性
                    normal: {
                        color: 'blue',
                    }
                },
              },
              {
                name: 'MIN 股价',
                data: this.minList,
                type: 'line',
                lineStyle: {
                    normal: {
                        color: '#FA6F53',
                    }
                },
              },
              {
                name: 'MAX 股价',
                data:  this.maxList,
                type: 'line',               // 类型为折线图
                lineStyle: {                // 线条样式 => 必须使用normal属性
                    normal: {
                        color: '#8AE09F',
                    }
                },

              },
          ]
        };
        // 使用刚指定的配置项和数据显示图表。
        this.chartLine.setOption(option);
        })
      }
  }
}


</script>

<style scoped>

</style>