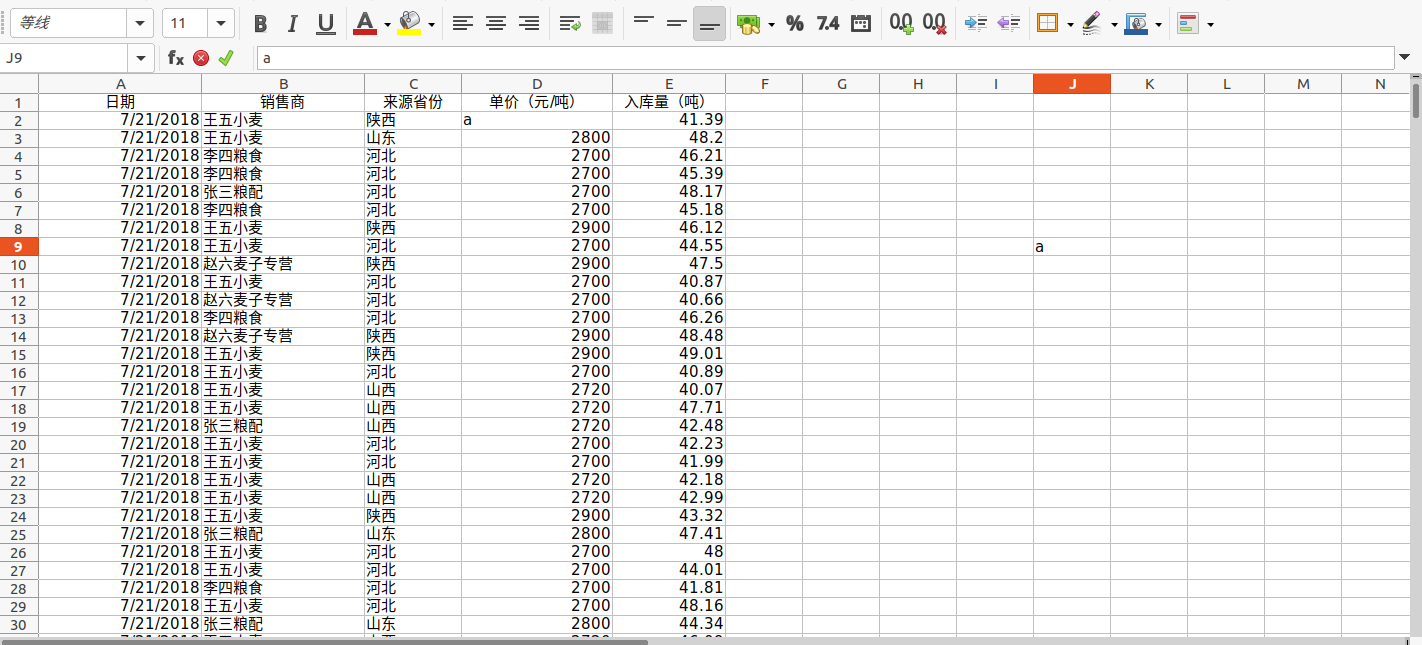
假设有像上这样一个表格,里面装满了各式各样的数据,现在要利用模板对它进行统计每个销售商的一些数据的总和。模板如下:
代码开始:
 1 #!usr/bin/python3
 2 # -*-coding=utf-8 -*-
 3
 4 import xlrd
 5 import xlwt
 6 from xlutils.copy import copy
 7
 8 xlsx = xlrd.open_workbook('template.xls') #打开数据来源工作簿
 9 table = xlsx.sheet_by_index(0) #读取表格索引为0的表
10
11 all_data = [] #此列表用于存储我们需要的在excel中的内容
12
13 #for循环读取表格
14 for n in range(1, table.nrows): #nrows代表excel表格的每一样;从1开始代表忽略表头,也就是从第二行开始
15     company = table.cell(n,1).value #每次循环都读取n+1行第2列的内容并赋值给company
16     price = table.cell(n,3).value #每次循环都读取n+1行第4列的内容并赋值给price
17     weight = table.cell(n,4).value #每次循环都读取n+1行第5列的内容并赋值给weight
18
19     data = {'company':company, 'weight':weight, 'price':price} #用字典存储内容
20     all_data.append(data) #将字典逐一追加到空列表
21
22 #新建空列表用于存储数据
23 #存储销售商张三粮配的数据总重量和总价格
24 a_total_weight = []
25 a_total_price = []
26 #存储销售商李四粮食的数据总重量和总价格
27 b_total_weight = []
28 b_total_price = []
29 #存储销售商王五小麦的数据总质量和总价格
30 c_total_weight = []
31 c_total_price = []
32 #存储销售商赵六麦子专营的数据的总重量和总价格
33 d_total_weight = []
34 d_total_price = []
35
36 #开始循环列表
37 for i in all_data:
38     if i['company'] == "张三粮配":
39         a_total_weight.append(i['weight'])
40         a_total_price.append(i['weight'] * i['price'])
41     if i['company'] == "李四粮食":
42         b_total_weight.append(i['weight'])
43         b_total_price.append(i['weight'] * i['price'])
44     if i['company'] == "王五小麦":
45         c_total_weight.append(i['weight'])
46         c_total_price.append(i['weight'] * i['price'])
47     if i['company'] == "赵六麦子专营":
48         d_total_weight.append(i['weight'])
49         d_total_price.append(i['weight'] * i['price'])
50
51 #选择模板
52 tem_excel = xlrd.open_workbook('countTemplate.xls',formatting_info=True)
53 tem_sheet = tem_excel.sheet_by_index(0)
54
55 #复制模板
56 new_excel = copy(tem_excel)
57 new_sheet.get_sheet(0)
58
59 #添加样式
60 style = xlwt.XFStyle()
61
62 #设置样式字体
63 font = xlwt.Font()
64 font.name = "微软雅黑" #设置字体名称
65 font.bold = True #设置字体加粗
66 font.height = 200 #设置字体大小,字体大小的算法是字体大小乘以20;
67 style.font = font #将字体样式添加到整体样式
68
69 #设置边框样式
70 borders = xlwt.Borders()
71 borders.top = xlwt.Borders.THIN #设置上边框的样式为细线
72 borders.left = xlwt.Borders.THIN #设置左边框的样式为细线
73 borders.bottom = xlwt.Borders.THIN #设置下边框的样式为细线
74 borders.right = xlwt.Borders.THIN #设置右边框的样式为细线
75 style.borders = borders #将边框样式添加到整体样式
76
77 #设置对齐样式
78 alignment = xlwt.Alignment()
79 alignment.horz = xlwt.Alignment.HORZ_CENTER #设置水平对齐样式为居中
80 alignment.vert = xlwt.Alignment.VERT_CENTER #设置垂直对齐样式为居中
81 style.alignment = alignment #加对齐样式添加到总样式
82
83 #开始写入数据
84 new_sheet.write(2,1, len(a_total_weight), style)
85 new_sheet.write(2,2, round(sum(a_total_weight), 2), style)
86 new_sheet.write(2,3, round(sum(a_total_price), 2), style)
87 new_sheet.write(3,1, len(b_total_weight), style)
88 new_sheet.write(3,2, round(sum(b_total_weight), 2), style)
89 new_sheet.write(3,3, round(sum(b_total_price), 2), style)
90 new_sheet.write(4,1, len(c_total_weight), style)
91 new_sheet.write(4,2, round(sum(c_total_weight), 2), style)
92 new_sheet.write(4,3, round(sum(c_total_price), 2), style)
93 new_sheet.write(5,1, len(d_total_weight), style)
94 new_sheet.write(5,2, round(sum(d_total_weight), 2), style)
95 new_sheet.write(5,3, round(sum(d_total_price), 2), style)
96
97 #保存工作簿
98 new_excel.save('results.xls')
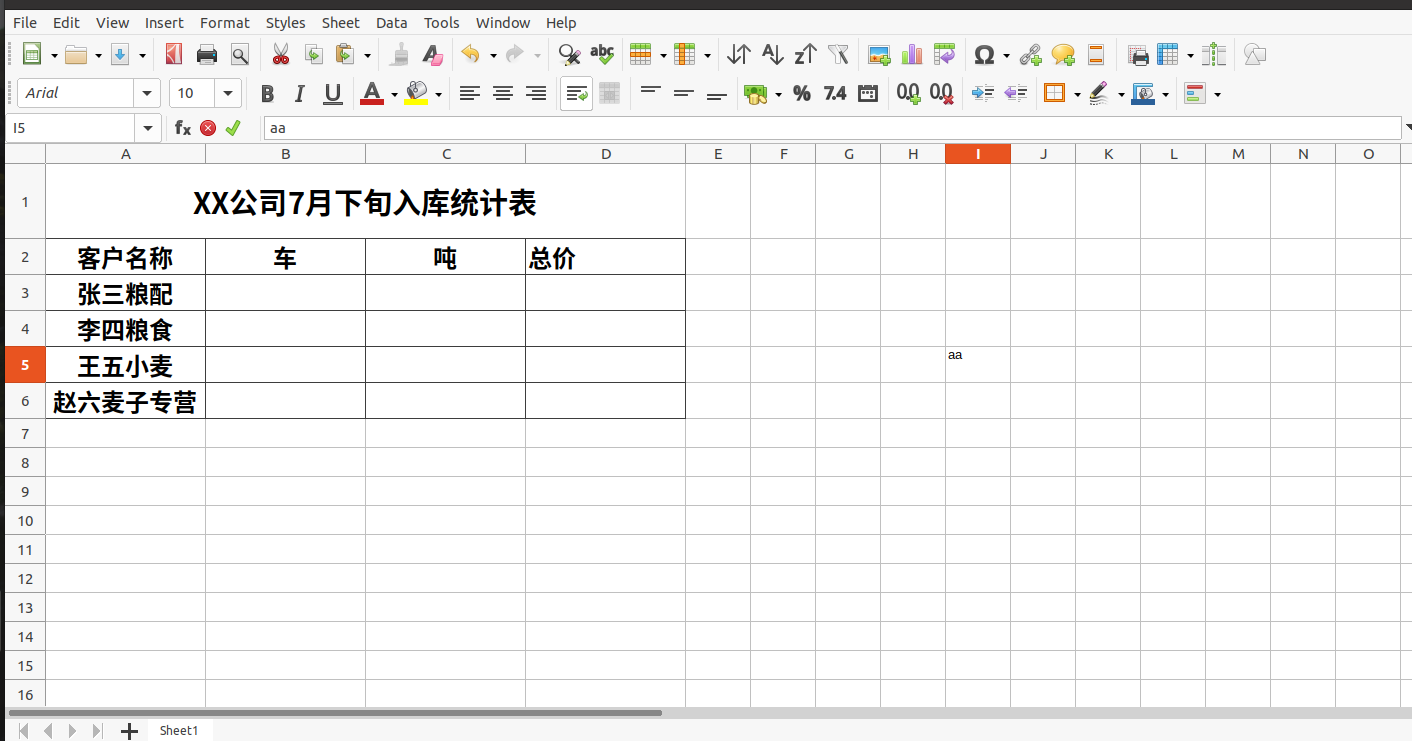
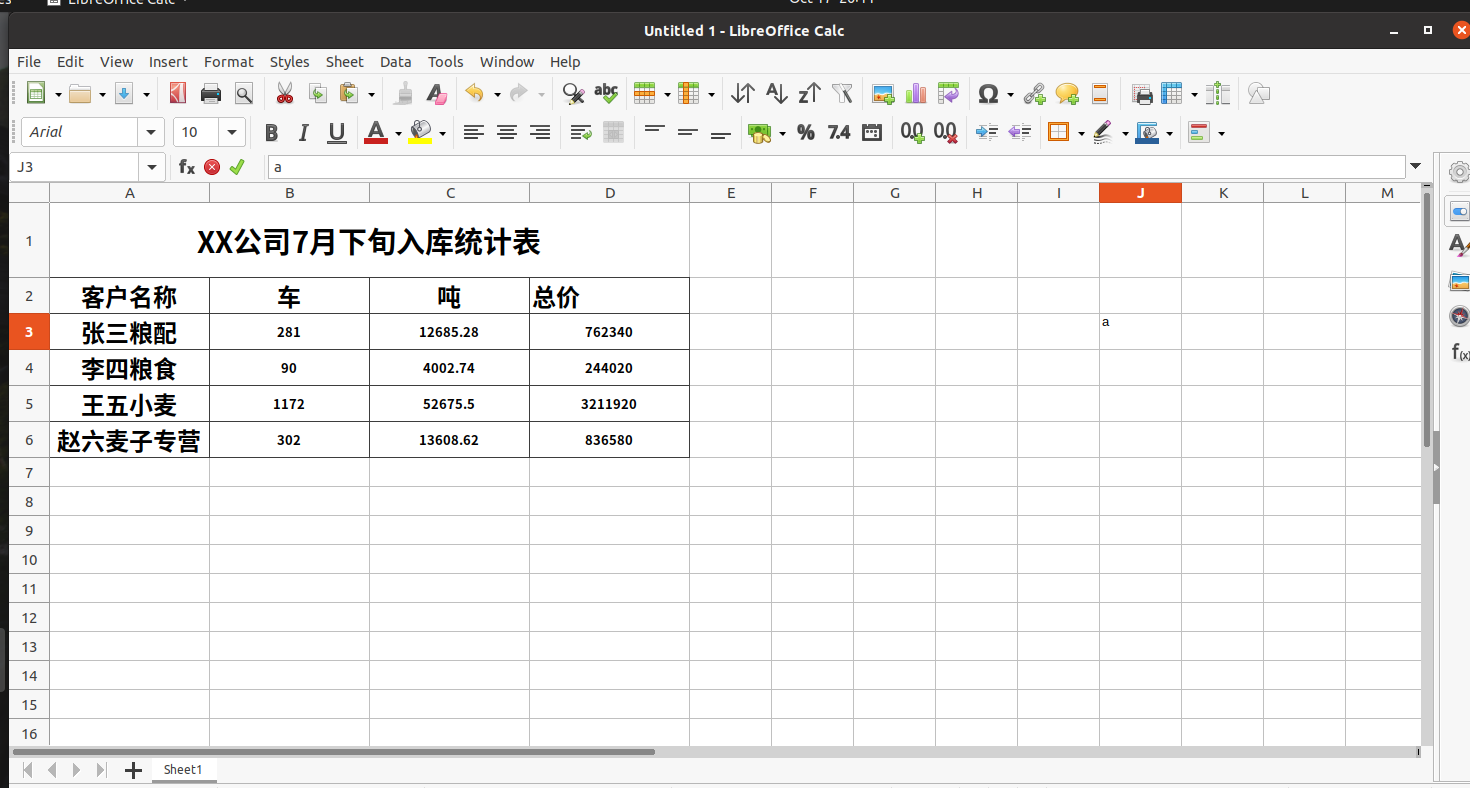
最终效果:
总结步骤:
1,先打开要处理的数据表;
2,根据要求读取数据表的内容并别存储;
3,复制模板并存储为新的工作簿;
4,向新的工作簿里写入提取的要求数据;
5,设置样式;
6,保存工作簿。