本节中我们将使用DGL批处理多个大小和形状可变的图形。
使用包含如下8种类型图的数据集。
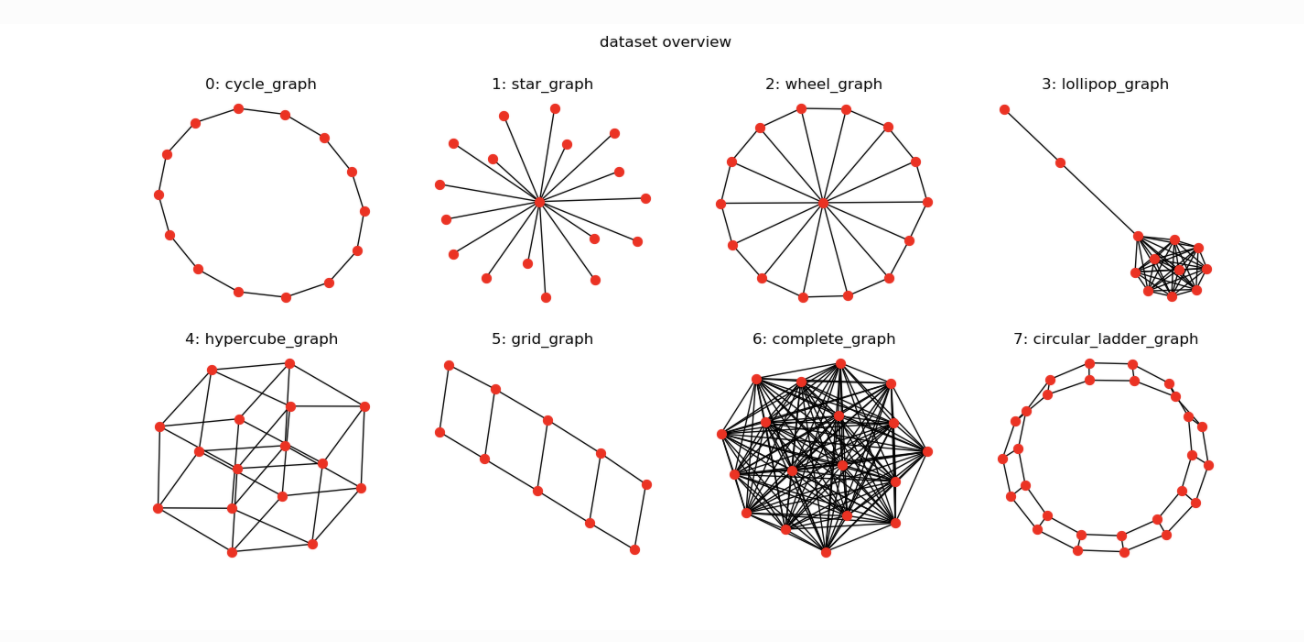
from dgl.data import MiniGCDataset
import matplotlib.pyplot as plt
import networkx as nx
dataset = MiniGCDataset(80, 10, 20) ## 产生80个样本, 每个样本的节点数位于 [10,20]之间
graph, label = dataset[10]
fig, ax = plt.subplots()
nx.draw(graph.to_networkx(), ax=ax)
ax.set_title('Class: {:d}'.format(label))
plt.show()

图像由于张量大小一致,很容易就可以进行批量学习。图如何进行批量学习?
图批量学习主要有以下两个挑战。
1. 图是稀疏的。 2. 不同图中的节点数和边数是不同的。
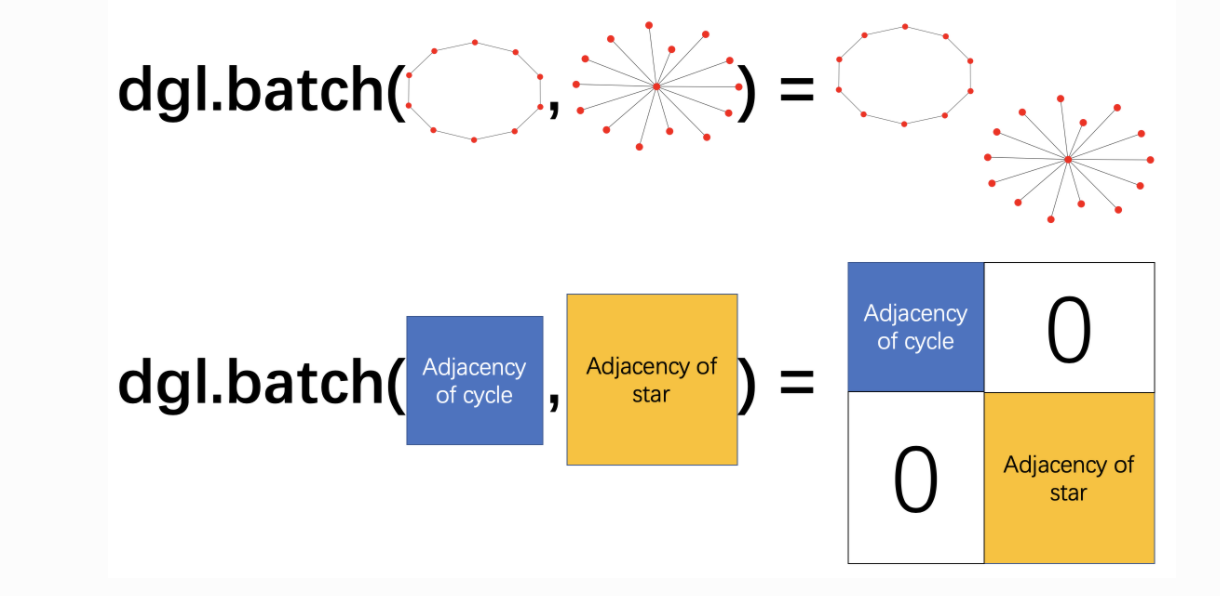
为了解决这个问题,DGL提供了dgl.batch() 进行批处理。 他的想法是将一批图视为一张大图,大图里面有多个不相连的连通分量吗,如下所示。
定义collate函数,从给定的Graph和label对列表中形成一个mini-batch。返回值依然是一个DGLGraph 和 label组成的tensor, 这样做DGL能够并行处理边和节点,大大提高了效率。
import dgl
import torch

def collate(samples):
    # The input `samples` is a list of pairs
    #  (graph, label).
    graphs, labels = map(list, zip(*samples))
    batched_graph = dgl.batch(graphs)
    return batched_graph, torch.tensor(labels)
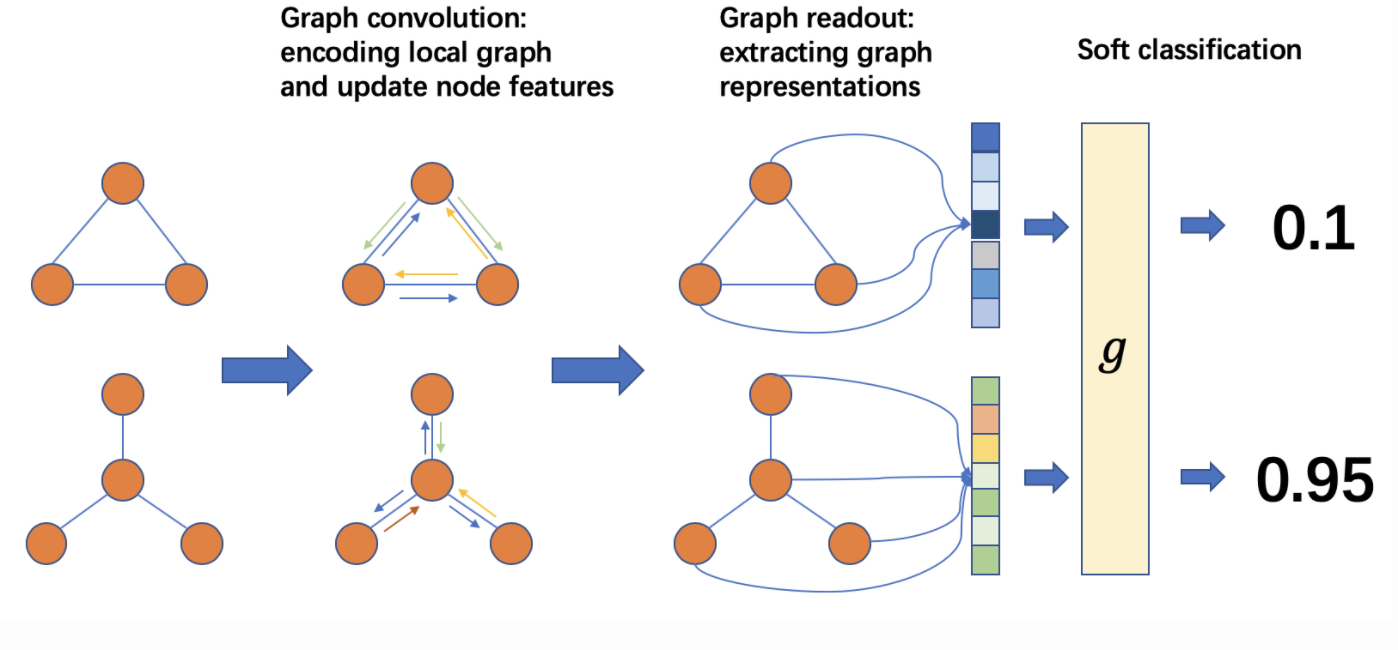
整个算法的流程框架如下:
在一个batch的graph中,执行消息传递和GraphConv,使得节点与其他节点进行通信。 消息传递后,根据节点(边)的属性计算一个张量作为graph representation。 此步骤被称为readout或aggregation。 最后,将输入graph representation到分类器g中进行预测。
模型结构: 输入特征是节点的入度,通过两层图卷积之后,将图中所有节点的输出拼接起来,作为图的表示向量,再通过一个全连接神经网络进行分类。
from dgl.data import MiniGCDataset
import dgl
import torch
from torch.utils.data import DataLoader
from dgl.nn.pytorch import GraphConv
import torch.nn as nn
import torch.nn.functional as F


class Classifier(nn.Module):
    def __init__(self, in_dim, hidden_dim, n_classes):
        super(Classifier, self).__init__()
        self.conv1 = GraphConv(in_dim, hidden_dim)
        self.conv2 = GraphConv(hidden_dim, hidden_dim)
        self.classify = nn.Linear(hidden_dim, n_classes)

    def forward(self, g):
        # 使用节点的入度作为初始特征
        h = g.in_degrees().view(-1,1).float()
        h = F.relu(self.conv1(g, h))
        h = F.relu(self.conv2(g, h))
        g.ndata['h'] = h ## 节点特征经过两层卷积的输出
        hg = dgl.mean_nodes(g, 'h') # 图的特征是所有节点特征的均值
        y = self.classify(hg)
        return y
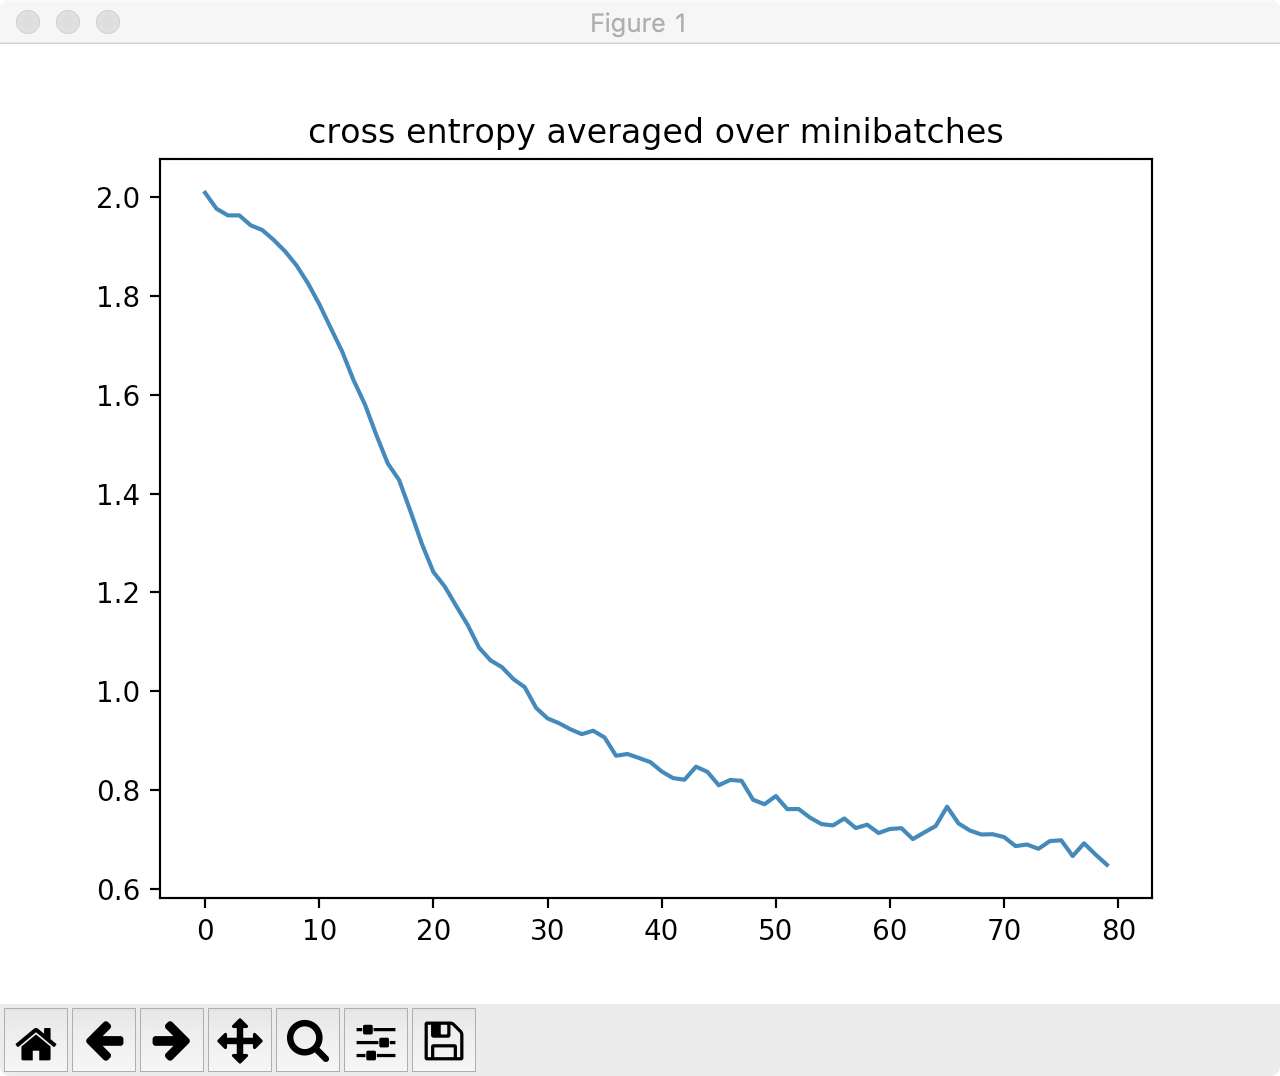
训练模型:
## 训练模型
trainset = MiniGCDataset(320, 10, 20) ## 产生80个样本, 每个样本的节点数位于 [10,20]之间
testset = MiniGCDataset(80, 10, 20)

def collate(samples):
    # The input `samples` is a list of pairs
    #  (graph, label).
    graphs, labels = map(list, zip(*samples))
    batched_graph = dgl.batch(graphs)
    return batched_graph, torch.tensor(labels)

data_loader = DataLoader(trainset, batch_size=32, shuffle=True,collate_fn=collate)

model = Classifier(1, 256, trainset.num_classes)
loss_func = nn.CrossEntropyLoss()
optimizer = torch.optim.Adam(model.parameters(), lr = 0.001)

model.train()

epoch_losses = []
for epoch in range(80):
    epoch_loss = 0
    for iter, (bg, label) in enumerate(data_loader):
        prediction = model(bg)
        loss = loss_func(prediction, label)
        optimizer.zero_grad()
        loss.backward()
        optimizer.step()
        epoch_loss+=loss.detach().item()
    epoch_loss /= (iter+1)

    print('Epoch {}, loss {:.4f}'.format(epoch, epoch_loss))
    epoch_losses.append(epoch_loss)
plt.title('cross entropy averaged over minibatches')
plt.plot(epoch_losses)
plt.show()
测试模型:
model.eval()
# Convert a list of tuples to two lists
test_X, test_Y = map(list, zip(*testset))
test_bg = dgl.batch(test_X)
test_Y = torch.tensor(test_Y).float().view(-1, 1)
probs_Y = torch.softmax(model(test_bg), 1)
sampled_Y = torch.multinomial(probs_Y, 1)
argmax_Y = torch.max(probs_Y, 1)[1].view(-1, 1)
print('Accuracy of sampled predictions on the test set: {:.4f}%'.format(
    (test_Y == sampled_Y.float()).sum().item() / len(test_Y) * 100))
print('Accuracy of argmax predictions on the test set: {:4f}%'.format(
    (test_Y == argmax_Y.float()).sum().item() / len(test_Y) * 100))