二十二、进程管理工具

pstree,ps,pgrep

pkill,pidof

top,htop

glance,pmap,

vmstat,dstat

kill,pkill

job,bg,fg,nohup

sar(内存),tsar,iosstat(磁盘IO),iftop(网络接口数据)

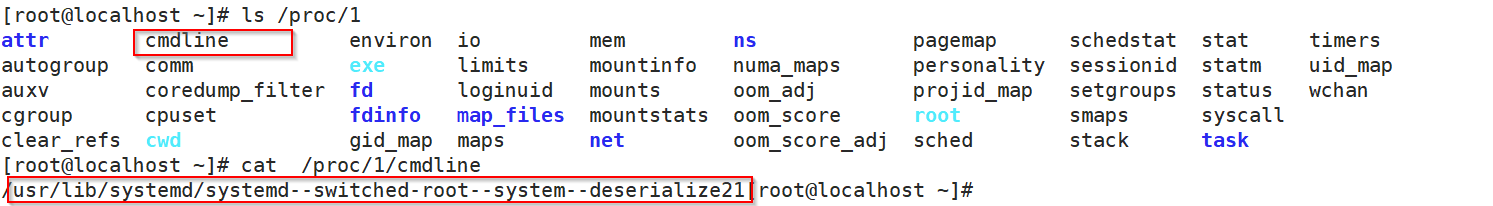
Linux 系统各进程的相关信息均保存在/proc/PID目录下的个文件中,而进程查看的命令都是遍历去读取该目录下的内容

  靠什么命令来启动相应进程的 就在cmdline文件中

一、pstree显示进程树

二、ps

2.1、BSD风格:

    ps option      

   a 与终端相关的进程

    x 与终端无关的进程

    u 与用户相关的进程

    Z 安全标签(安全上下文)

    o 自定义显示格式

[root@izpo45bh60h6bsz ~]# ps aux 
USER       PID %CPU %MEM    VSZ   RSS TTY      STAT START   TIME COMMAND
USER: 进程用户
PID: 进程PID
%CPU: 运行占据CPU时间百分比
VSZ:虚拟内存集:可交换出的数据   一般大于RSS
RSS: 常驻内存集:不可交换出的数据
TTY: 通过哪个终端启动  (?代表与终端无关)
STAT:进程状态
    R(Running),S(Interrupt Sleeping),D(uninterrupt Sleeping),T(Stopped),z(zombie)
    +:前台
   l: 多线程进程
N:低优先级
   < :高优先级进程 s 领导进程, START: 进程启动时间 TIME: 进程运行过程占据CPU累积时长 COMMAND: 由什么命令启动的相关进程

2.2、System V 风格

  ps option

    -e:相当于 ax
    -f:显示详细信息
   -F:显示完整格式的进程信息
-H hierarchy 层级结构显示
 
   -eFH :以进程层级格式显示进程相关信息
[root@izpo45bh60h6bsz ~]# ps -ef 
UID        PID  PPID  C STIME TTY          TIME CMD
[root@izpo45bh60h6bsz ~]# ps -eF 
UID        PID  PPID  C    SZ   RSS PSR STIME TTY   TIME CMD
自定义显示:
[root@izpo45bh60h6bsz ~]# ps axo pid,ppid,ni,psr,pri,rtprio,time,cmd    PID  PPID  NI PSR PRI RTPRIO     TIME CMD


ppid: 父进程id,0代表 天造地设
PRI: priority
PSR: 运行在哪个cpu上
rtprio: realtime priority 实时优先级
C cpu编号 (多个CPU时会显示不同编号)

三、pgrep,pkill

  pgrep [option] pattern

  pkill [option] pattern

        -u euid :effective user 有效用户(suid的属主) 

        -U uid  : real user真实用户

        -t terminal 与指定终端相关的进程

        -a 完整格式的进程名

        -l 显示进程名

        -P PPID 显示PPID的子进程列表

pidof :根据进程名获取其PID

[root@izpo45bh60h6bsz ~]# pgrep sshd
4472
10829

[root@izpo45bh60h6bsz ~]# pgrep sshd -l
4472 sshd
10829 sshd

[root@izpo45bh60h6bsz ~]# pgrep sshd -a
4472 /usr/sbin/sshd -D
10829 sshd: root@pts/0    

[root@izpo45bh60h6bsz ~]# pgrep -P 4472
10829

[root@izpo45bh60h6bsz ~]# pgrep -t pts/0
10831

[root@izpo45bh60h6bsz ~]# pgrep -t pts/0 -l
10831 bash

[root@izpo45bh60h6bsz ~]# pgrep -t pts/0 -a
10831 -bash

四、top命令

top option

    -d #  :刷新时间间隔  默认为3秒

    -b 批次显示

    -n # 显示多少批次 与-b连胜 

排序方式:(在键盘上输入如下命令进行排序)

    P %CPU 占据CPU百分比(过去几秒占据CPU百分比:几秒由刷新定义)

    M %MEM 占据内存百分比

    T TIME  :累计占据CPU时长

首部信息 

  第一行: uptime: 可按“l” 显示或取消该行信息  

top - 11:20:24 up 30 days, 13:20, 2 user, load average: 0.04, 0.03, 0.05  

“11:20:24”为系统当前时刻;
“13:20”为系统启动后到现在的运作时间;
“2 users”为当前登录到系统的用户,
更确切的说是登录到用户的终端数 -- 同一个用户同一时间对系统多个终端的连接将被视为多个用户连接到系统,这里的用户数也将表现为终端的数目;

load average: 0.03, 0.01, 0.05  过去一分钟、五分钟、十五分钟的平均负载

  CPU队列中等待运行的任务的个数,而不是CPU占据百分比

    第二行 :tasks: 可按 “t” ---CentOS 6上只有显示或取消,;CentOS 7上以进度条方式显示如图

    第三行:显示每个cpu: 可按“1”

 %Cpu(s):  0.0 us, 0.1 sy, 0.0 ni,99.9 id, 0.0 wa, 0.0 hi, 0.0 si, 0.0 st   

%Cpu:cpu占用百分比

0.0 us:用户空间占用的百分比

0.1 sy:内核空间占用时间的百分比

0.0 ni:对nice调整占用的内存百分比

99.9 id:空闲百分比

0.0 wa:等待IO完成所消耗的百分比

0.0 hi:处理硬件中断所占用的百分比

0.0 si:处理软件中断所占用的百分比(模式切换)

0.0 st:被偷走的百分比(虚拟化程序)

    第四行:Mem/Swap: 可按 “m”

进程信息 : 

PR 优先级
NI   Nice值
VIRT  相当于VRT  虚拟内存集
RES   相当于RSS  常驻内存集
SHR   shared    共享内存大小
S    STATE      状态

退出top命令 :敲"q"键
修改刷新时间间隔 : 敲“s”键
终止指定进程: 敲“k”键

五、htop

注:需要Fedora-EPEL源

yum 包

[Fedora-EPEL]
name=Fedora EPEL for EL6
baseurl=https://mirrors.aliyun.com/epel/6/$basearch
gpgcheck=0

选项:

   -d #  :指定延迟时间

  -u UserName : 仅显示指定用户的进程

  -s COLOMN:以指定字段进行排序

获取帮助:  F1

选定进程后,按如下键

    s: syscall 跟踪选定进程的系统调用

    t :tree ,层级结构显示

    l :显示选定进程打开的文件列表

    a :设置进程和cpu亲源性,进程只能运行在某个cpu上,增加缓存命中率

    F6 > 以指定字段排序


六、vmstat命令 虚拟内存工具virtual memory state

vmstat [delay[count]]

    delay 延迟几秒刷新一次

    count 刷新几次

-p partiton

内存信息查看

    vmstat -s  :显示内存的统计数据

    /proc/memoinfo

[root@izpo45bh60h6bsz ~]# vmstat
procs -----------memory---------- ---swap-- -----io---- -system-- ------cpu-----
 r  b   swpd   free   buff  cache   si   so    bi    bo   in   cs us sy id wa st
 3  0      0 208496  37940 465952    0    0    21     8  107  256  0  0 99  0  0

procs 进程 

  r running 等待队列的进程的个数 

  b block阻塞 --处于不可终端睡眠态的进程个数(被阻塞的队列的长度)

memory 内存

  swpd 交换内存使用的总量

  free 空闲物理内存总量

  buff 内存中buff大小

  cache 内存中cache大小


swap (站在交换内存角度)

  si 从物理内存加载至swap的速率(kb/s)

  so 从swap加载至物理内存的速率


io (站在系统角度)

  bi input 从磁盘加载至内存的速率(kb/s)

  bo output 从内存加载至磁盘的速率


system 系统

  in/int interrupt 中断,每秒多少个中断

  cs   context switch 进程上下文切换次数(保存现场和恢复现场的切换次数)


cpu 

  us user space

  sy system space/kernel space

  id idle

  wa wait 等待IO完成的时间比率

  st stole 被虚拟化技术偷走的比率

 七、pmap报告内存映射表

 pmap [-x|-p|-d|-q]  pid   

      -x extend显示扩展格式

      -p 显示映射的完整路径

      -d 显示设备信息

      -q 不显示首尾信息

 查看内存映射表

          /proc/PID/maps

          pmap pid

   功能: 线性内存地址和物理地址映射关系

  进程只知道线性地址

    1、进程将打开的文件存储在进程内存地址空间中,分段存储

    2、进程划分的空间为4K的整数倍(内存页的大小为4K)

    3、heap堆、stack栈、anon: anonymous 匿名页---进程自己存储数据的位置,不能交换出去

Address           Kbytes     RSS   Dirty Mode  Mapping
00007ff5a8000000     164      12      12 rw---   [ anon ]
00007ff5a8029000   65372       0       0 -----   [ anon ]
00007ff5ac94d000       4       0       0 -----   [ anon ]
00007ff5ac94e000    8192       8       8 rw---   [ anon ]
00007ff5ad14e000       4       0       0 -----   [ anon ]
00007ff5ad14f000    8192       8       8 rw---   [ anon ]
00007ff5ad94f000      16       8       0 r-x-- libuuid.so.1.3.0
00007ff5ad953000    2044       0       0 ----- libuuid.so.1.3.0
00007ff5adb52000       4       4       4 r---- libuuid.so.1.3.0
00007ff5adb53000       4       4       4 rw--- libuuid.so.1.3.0
00007ff5adb54000     228      40       0 r-x-- libblkid.so.1.1.0
00007ff5adb8d000    2048       0       0 ----- libblkid.so.1.1.0
00007ff5add8d000      12      12      12 r---- libblkid.so.1.1.0
00007ff5add90000       4       4       4 rw--- libblkid.so.1.1.0
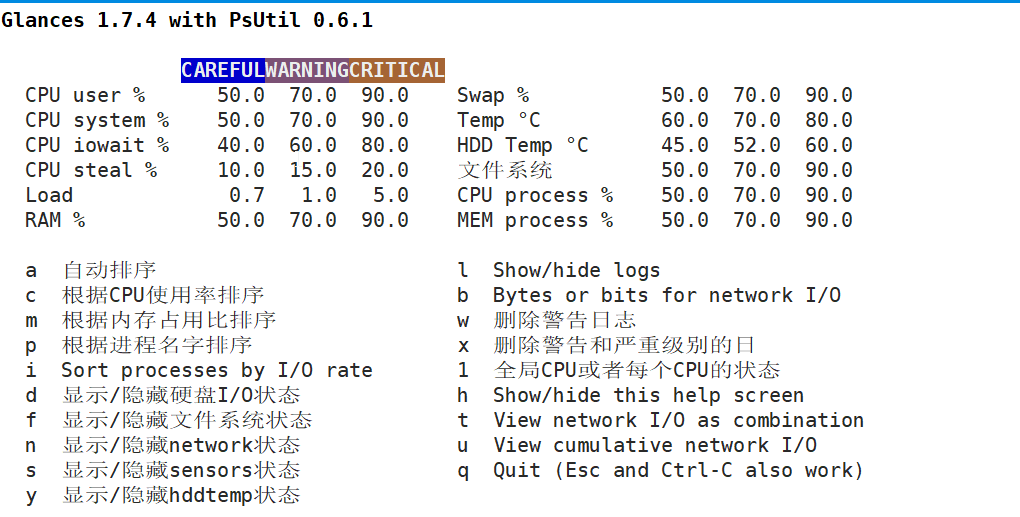
八、glances命令

    galances [options...] 

         -s -B IPADDR 服务端模式

      IPADDR:指明监听于本机哪个地址

         -c IPADDR   客户端模式

      IPADDR:要连入的服务器端地址

   常用选项:     

            b :以字节Byte为单位显示网络速率

            m/n/d  :控制mount,network,disk模块的显示或隐藏

            t # :延迟间隔

            1 : 每个cpu信息单独显示


          -f /path/to/somefile galance:显示的结果保存至文件中

         -o {HTML|CSV} 文件的格式

 galance内建命令

   服务端

[root@localhost ~]# glances -s -B 192.168.1.103 -p 8888 -P "1234"
Glances server is running on 192.168.1.103:8888

      客户端

[root@localhost ~]# glances -c 192.168.1.103 -p 8888
Error: Connection to server failed. Bad password.
[root@localhost ~]# glances -c 192.168.1.103 -p 8888 -P "1234"
[root@localhost ~]# 
Connected to 192.168.1.103 | Press 'h' for help

九、dstat

重新换回CLI的颜色使用:reset

vmstat替换工具

        dstat options

            -c:显示cpu相关信息

      -C #,#,..,total (指明CPU代表号) 

            -d  :显示disk相关信息

      -D total,/dev/sda,/dev/sdb,...

            -g page显示内存数据交换的速率

            -i  :显示中断速率

            -l, --load   显示平均负载

            -m,--mem   显示内存相关统计数据;

            -n,--net    显示网络相关统计数据;

            -p,--proc       进程状态

            -r,--io       显示io相关的统计数据

            -s,--swap   显示swap 相关的统计数据

            -t,--time        时间输出

            --aio              异步io

            --fs,--filesystem 显示文件系统

            --ipc (message queue(signal),semephores,shared memory)

            --lock 文件锁

            --socket (total,udp,tcp,raw,ip-fragment分片)

            --tcp (listen,established,syn,time_wait,close)

            --udp (listen,active)

            --unix (datagram, stream, listen, active)

----total-cpu-usage---- -dsk/total- -net/total- ---paging-- ---system--
usr sys idl wai hiq siq| read  writ| recv  send|  in   out | int   csw 

total-cpu-usage cpu使用状态
dsk/total       磁盘读写速率
net/total       网络的收发速率
paging          页面的换进换出(内存页面,交换内存。 si,so)
system          中断和上下文切换 (int: interrupt, csw: context swtich。 in,cs )

使用示例

1、cpu相关的信息

[root@localhost ~]# dstat  -c
----total-cpu-usage----
usr sys idl wai hiq siq

[root@localhost ~]# dstat  -C total,0
Terminal width too small, trimming output.
----total-cpu-usage------------cpu0-usage------ -dsk/total- -net/total- ---paging-->
usr sys idl wai hiq siq:usr sys idl wai hiq siq| read  writ| recv  send|  in   out >

2、硬盘相关

[root@localhost ~]# dstat  -d
-dsk/total-
read  writ  

[root@localhost ~]# dstat  -D total,/dev/sda
----total-cpu-usage---- -dsk/total----dsk/sda-- -net/total- ---paging-- ---system--
usr sys idl wai hiq siq| read  writ: read  writ| recv  send|  in   out | int   csw

3、页面

[root@localhost ~]# dstat  -g
---paging--

4、显示中断

[root@localhost ~]# dstat  -i
----interrupts---

5、平均负载

[root@localhost ~]# dstat  -l
---load-avg---
 1m   5m  15m

6、内存

[root@localhost ~]# dstat -m
------memory-usage-----
 used  buff  cach  free

7、网络

[root@localhost ~]# dstat -n
-net/total-
 recv  send

8、进程

 ---procs---
run blk new
  run 运行进程的数据
  new 创建新进程的数据

9、io

[root@localhost ~]# dstat -r
--io/total-
 read  writ

10、swap

[root@localhost ~]# dstat -s
----swap---
 used  free

11、时间

[root@localhost ~]# dstat -t
----system----
  date/time

12、异步IO

[root@localhost ~]# dstat --aio
async
 #aio 

13、文件系统

[root@localhost ~]# dstat --fs
--filesystem-
files  inodes

14、进程通信

[root@localhost ~]# dstat --ipc
--sysv-ipc-
msg sem shm

15、文件锁

[root@localhost ~]# dstat --lock
---file-locks--
pos lck rea wri

16、套接字

[root@localhost ~]# dstat --socket
------sockets------
tot tcp udp raw frg

17、tcp连接

[root@localhost ~]# dstat --tcp
----tcp-sockets----
lis act syn tim clo

18、udp连接

[root@localhost ~]# dstat --udp
--udp--
lis act

19、unix连接

[root@localhost ~]# dstat --unix
--unix-sockets-
dgm str lis act 

20、-a

[root@localhost ~]# dstat -a 1 1
----total-cpu-usage---- -dsk/total- -net/total- ---paging-- ---system--
usr sys idl wai hiq siq| read  writ| recv  send|  in   out | int   csw
 
[root@localhost ~]# dstat  --disk-util
sda-
util

22、文件系统空闲

[root@localhost ~]# dstat  --freespace
-----/----------/shm-------/boot-------/home--------/usr--------/var---
 used  free: used  free: used  free: used  free: used  free: used  free
3101M 44.9G:   0   121M:57.4M  419M: 260M 4534M:2091M 12.3G: 714M 9001M

23、插件注释

[root@localhost ~]# dstat  --helloworld
plugin-title
  counter   
Hello world!
Hello world!
Hello world!
Hello world!

24、显示最占用CPU的进程

[root@izpo45bh60h6bsz ~]# dstat --top-cpu
-most-expensive-
  cpu process   
AliYunDun    0.2
aliyun-servic1.0

25、中断次数最多

[root@izpo45bh60h6bsz ~]# dstat --top-in
---most-frequent----
     interrupt      
ata_piix          1 
virtio0-input.0   1

26、最占用io的进程

[root@izpo45bh60h6bsz ~]# dstat --top-io
----most-expensive----
     i/o process      
systemd      29k   10k
sshd: root@ 146B  196B

27、最占用内存的进程

[root@izpo45bh60h6bsz ~]# dstat --top-mem
--most-expensive-
  memory process 
mysqld       123M

28、延迟最大的进程

[root@izpo45bh60h6bsz ~]# dstat  --top-latency
--highest-total--
 latency process 
rcu_sched     882

十、kill--想进程发送控制信号,以实现对进程管理


kill命令

    显示当前系统可用信号信号:kill -l

        man 7 signal

1)SIGHUP:   不关闭进程重读配置文件。服务程序

2)SIGINT:   终止信号(interrupt) 相当于 Ctrl + c

9)SIGKILL:  杀死正在运行的进程   ,直接终止,

15)SIGTERM:  终止指定的进程(优雅) ,处理的数据存回磁盘中,再终止 

18)SIGCONT 让停止态的信号,continue

19)SIGSTOP 让运行中的进程,stop

 使用发信号的方法 SIGNAL:

        1、信号完整名称 : SIGHUP

        2、信号的简写名称: HUP

        3、信号的数字标识 :1,2,9

向进程发信号:

          kill -SIGNAL pid

终止“名称”之下的所有进程

          killall -SIGNAL 进程名

十一、linux的作业控制

 jobs一个任务可能包含单个进程也可能包含多个进程


    前台作业:与终端相关,占据命令提示符

    后台作业:与终端相关,但启动后即转入后台运行(不占据命令提示符)

 送到后台剥离与终端关系: # nohup  COMMMAND  &

    作业送到后台:

          运行中的程序:Ctrl + z

          尚未启动的程序:COMMAND &

 注:此类作业虽然被送往后台运行,但其依然与终端相关:如果希望送往后台,剥离与终端的关系


 查看所有作业情况: # jobs

          + 没有作业号,默认管理的作业

          - 下一个

          [#]作业号

    作业管理控制

        送到前台: fg [[%]JOB_NUM]

        送到后台: bg [[%]JOB_NUM]

        终止作业: kill -SIGNAL [%JOBNUM]

十二、nice值

    动态优先级:进程消耗过多的cpu资源时,内核自动调整,

    静态优先级: 100-139 (数据越小,优先级越高)

     实时优先级: 0-99 (数字越大,优先级越高)

进程默认启动优先级120,nice值为 0

    nice [-n # ] command

        -n # 启动后以#值作为Nice值运行,不给-n #,默认nice=10

对已经运行的进程做优先级调整

 renice -n #  pid(相应command的进程号)

        -n # 重新设置优先级

    查看nice值: # ps axo pid,command,ni


补充、sar,tsar,iosar,iftop

sar 

    -u cpu

    -d disk

    -B 交换页数据

    -b 报告IO传输速率

详解:-B

pgpgin/s pgpgout/s   fault/s  majflt/s  pgfree/s pgscank/s pgscand/s pgsteal/s   

pgpgin/s  物理内存到磁盘swap

fault 缺页异常发生的速率

majflt/s  major faults 

pgfree/s  page free place on

pgscank/s kswapd daemon scan pages

pgscnd/s  page scan directly

pgsteal/s page reclaimed from cache(pagecache and swap-cache)  

详解: -u 报告cpu使用率

 CPU     %user     %nice   %system   %iowait    %steal     %idle

详解: -b  

tps      rtps      wtps   bread/s   bwrtn/s

t 总传输

rtps 读传输

wtps 写传输

bread/s  从块读

bwrtn/s  写到块

tsar

iostat

Report Central Processing Unit (CPU) statistics and input/output statistics

       for devices and partitions.

 Central Processing Unit (CPU) 中央处理单元cpu

 statistics 统计数据

 for prep.为,为了;倾向于;关于;当作

    为设备和分区报告CPU,I/O统计数据

    iostat [-u | -d | -h | -k | -m]

        -u cpu

        -d disk

        -h human readable

        -k KB

        -m MB

        -N LVM2统计数据

CPU Utilization Report(Utilization 利用率)

 %user 运行用户级别/用户空间的进程CPU利用率百分比

 %nice nice priority占据CPU利用百分比

 %system system level(kernel)

 %iowait 系统有突出IO时,CPU空闲百分比。进程等待IO的百分比

 %steal 被虚拟化技术偷走的时间

 %idle CPU空闲和系统无IO所占时间百分比

Device Utilization Report

  Device 显示dev目录下的设备或Partition名

  tps 显示每秒IO请求传输至设备的数量,IO请求可以是单个,或多个IO请求组合成单个,大小不确定

kB_read/s     每秒从块或扇区读取数据量

kB_wrtn/s     每秒写

kB_read      总读

kB_wrtn      总写

rrqm/s      queued to device read request merged 合并读请求队列的速率

wrqm/s      合并写请求速率

iftop

1)获取命令的信息 命令行模式显示网络接口带宽统计数据“为什么我的ADSL连接如此慢”

[root@izpo45bh60h6bsz ~]# dnf info iftop
Using metadata from Wed Aug 23 00:36:04 2017
可安装的软件包
名称        : iftop
架构        : x86_64
时期        : 0
版本        : 1.0
发布        : 0.14.pre4.el7
大小        : 52 k
仓库        : epel
概要        : Command line tool that displays bandwidth usage on an interface
URL         : http://www.ex-parrot.com/~pdw/iftop/
协议        : GPLv2+
描述        : iftop does for network usage what top(1) does for CPU usage. It listens to
            : network traffic on a named interface and displays a table of current bandwidth
            : usage by pairs of hosts. Handy for answering the question "why is our ADSL link
            : so slow?".
 

2)安装包

[root@izpo45bh60h6bsz ~]# dnf install iftop
 

3)获取帮助

# man iftop 显示主机接口之上的网络带宽使用情况

 iftop -h | [-nNpblBP] [-i interface] [-f filter code] [-F net/mask] [-G net6/mask6]

默认情况会反解主机名,-n选项或运行中使用r命令关闭dns反解

默认会显示通过过滤器的所有IP包,IP包的方向是通过接口的方向

-F NETWORK 显示给定网络输入或输出的数据包 

忽略广播数据包: not ether host  ff:ff:ff:ff:ff:ff

过滤仅显示web数据包,排除:port http and not host webcache.example.com

用户浪费了多少带宽弄清楚网络如此慢:icmp

    -h 获取帮助

    -n 不从IP包中反解主机名

    -N 不反解端口号

    -p promise模式,流量不经过此接口也会统计

    -P 打开端口显示

    -b bar开关

    -m #[km] 仅显示由#指定的宽带比例上限对应的数据包

    -i IFACE 指监听接口

    -f filter code 过滤

    -F net/mask 过滤仅显示什么ip的数据包,包的方向由网络边界决定

    -c config_file 给出一个临时配置文件,默认 ~/.iftoprc


内建命令

S ,D , P ,p ,n ,N

Host display:                          General:
 n - toggle DNS host resolution         P - pause display
 s - toggle show source host            h - toggle this help display
 d - toggle show destination host       b - toggle bar graph display
 t - (revice,sent,two line,one line)            B - cycle bar graph average
                                        T - toggle cumulative line totals
Port display:                           j/k - scroll display
 N - toggle service resolution          f - edit filter code
 S - toggle show source port            l - set screen filter
 D - toggle show destination port       L - lin/log scales
 p - toggle port display                ! - shell command
                                        q - quit
Sorting:
 1/2/3 - sort by 1st/2nd/3rd column
 < - sort by source name
 > - sort by dest name
 o - freeze current order


显示注释

每个字段10秒平均流量显示

foo.example.com  =>  bar.example.com      1Kb  500b   100b
流量从 foo.example.com 到 bar.example.com
1Kb 前2秒数据被接收或发送的速率
500b 前10秒
100b 前40秒


过滤后的总传输流量
最近40s高峰流量
过去2s,10s,40s部传输速率
原文地址:https://www.cnblogs.com/liuzhiyun/p/11406969.html