clear;clc;close all
format compact
%% 正态分布的拟合
% 生成随机数
num = 50;
y = randn(1000,1);
x = 1:num;
y = hist(y,num);
xx = x(:);
yy = y(:);
% Set up fittype and options.
ft = fittype('y0+(a/(w*sqrt(pi/2)))*exp(-2*((x-xc)/w).^2)', 'independent', 'x', 'dependent', 'y');
opts = fitoptions(ft);
opts.Display = 'Off';
opts.Lower = [0 0 0 0];
opts.StartPoint = [1.1 1.1 1.1 1.1];
% Fit model to data.
[fitresult, gof] = fit( xx, yy, ft, opts );
% Plot fit with data.
figure;
plot(fitresult)
hold on
plot(xx, yy,'b*');
legend('原始数据', '拟合曲线', 'Location', 'NorthEast');
title(['正态分布拟合,num=',num2str(num)])
xlabel('x');
ylabel('y');
grid on
saveas(gcf,'pic.png')
%% 输出拟合参数
a = fitresult.a
w = fitresult.w
xc = fitresult.xc
y0 = fitresult.y0
%% 计算均方误差
yyy = y0+(a/(w*sqrt(pi/2)))*exp(-2*((xx-xc)/w).^2);
rmse = 1/length(yyy)*norm(yyy-yy);
fprintf('num = %d, rmse = %.2f
',num,rmse)
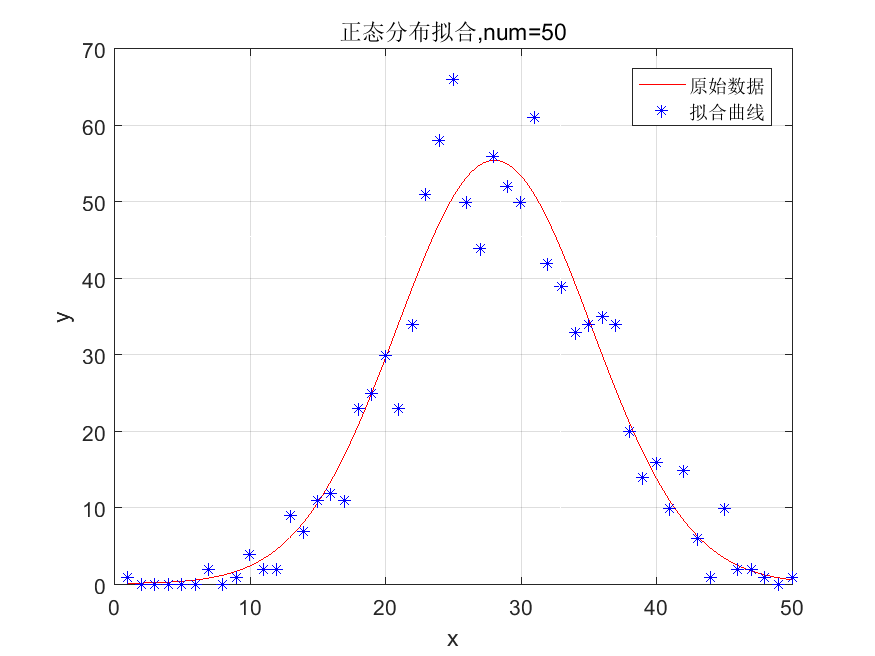
得到对应的参数为
a =
992.6775
w =
14.3208
xc =
28.0562
y0 =
0.1646
均方误差为
mse = 0.69