一、Grafana安装和启动
Grafana支持查询Prometheus。从Grafana 2.5.0(2015-10-28)开始包含Prometheus的Grafana数据源。
[root@prometheus ~]# wget https://dl.grafana.com/oss/release/grafana-6.5.2-1.x86_64.rpm
[root@prometheus ~]# yum localinstall grafana-6.5.2-1.x86_64.rpm -y
[root@prometheus ~]# systemctl enable grafana
[root@prometheus ~]# systemctl start grafana
[root@prometheus ~]# netstat -tulnp |grep 3000
tcp6       0      0 :::3000                 :::*                    LISTEN      34336/grafana-serve
默认情况下,Grafana将在http://localhost:3000上监听 。默认登录名是“ admin” /“ admin”,首次登陆提示修改密码,可以skip(跳过)。

二、配置数据源
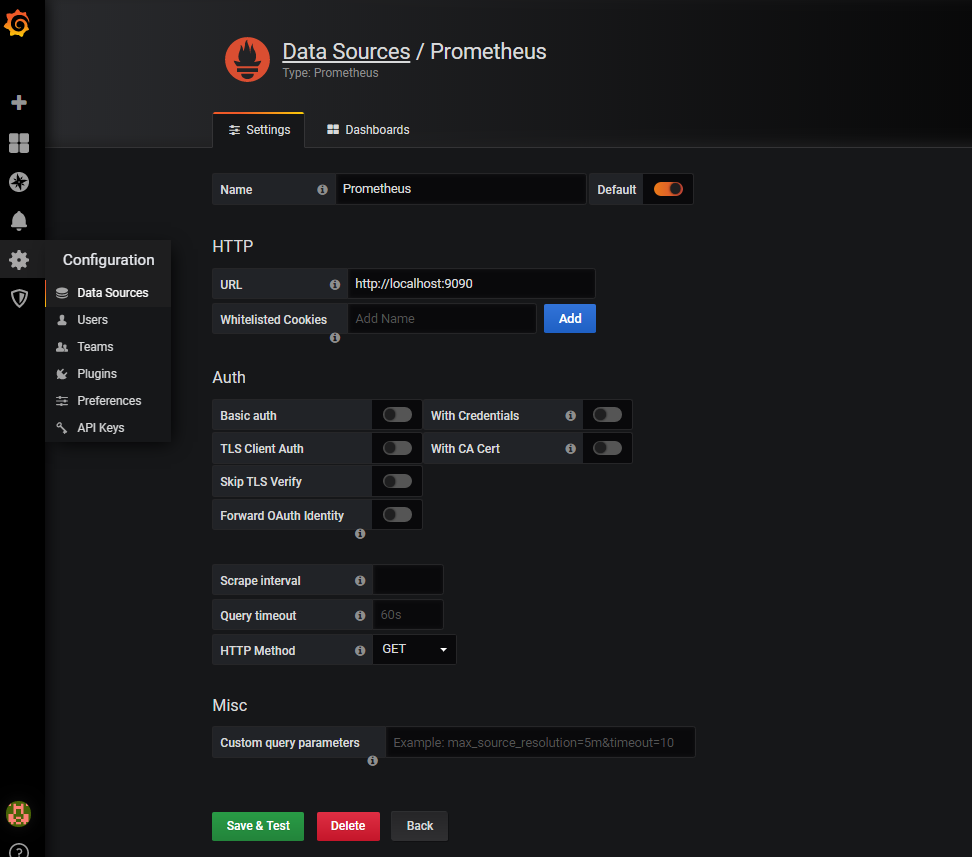
创建Prometheus数据源:
- 单击Grafana LOGO以打开侧边栏菜单。
- 单击边栏中的“Datasource”。
- 选择“Prometheus”。
- 填写Prometheus服务器网址(例如,http://localhost:9090/)
- 根据需要调整其他数据源设置(例如,关闭代理访问)。
- 点击“Save&Test”以保存新的数据源。
三、配置dashboard
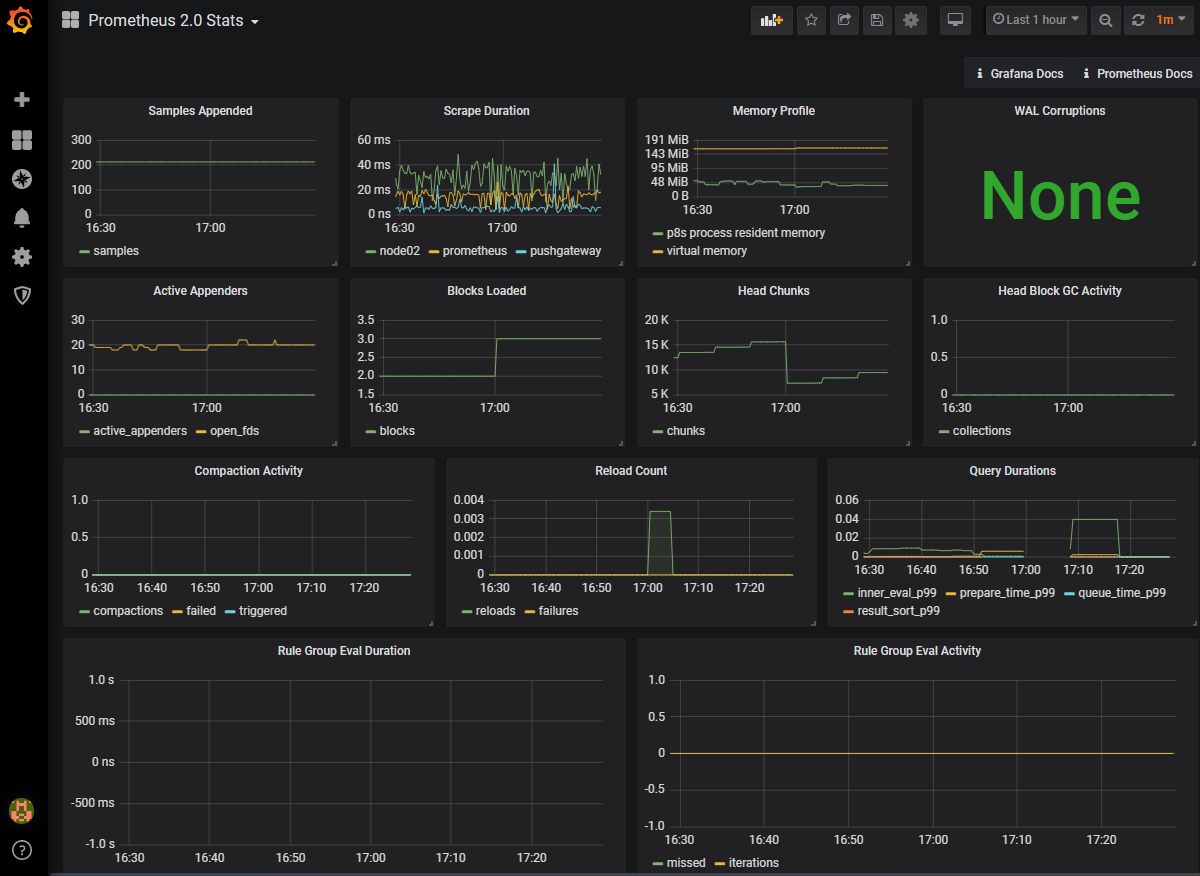
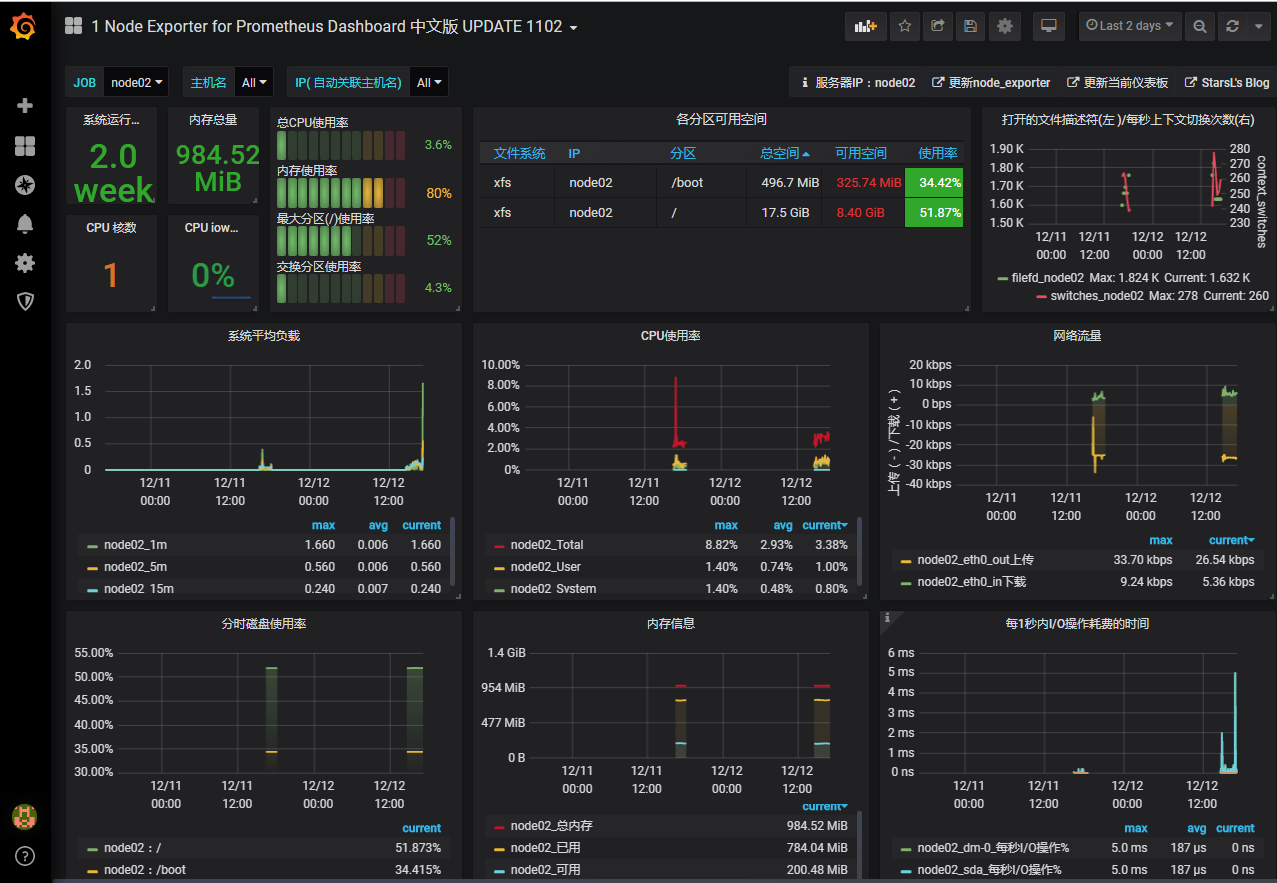
配置dashboard有两种方式,一种是自定义编辑增加各种指标,一种是通过官网上大佬搞出来的dashboard模板加载,这里加载了第二种方式。另外在增加dashboard的时候会自动添加prometheus本身的监控模板,添加完成后,可以看到prometheus server的各种资源指标,如图:
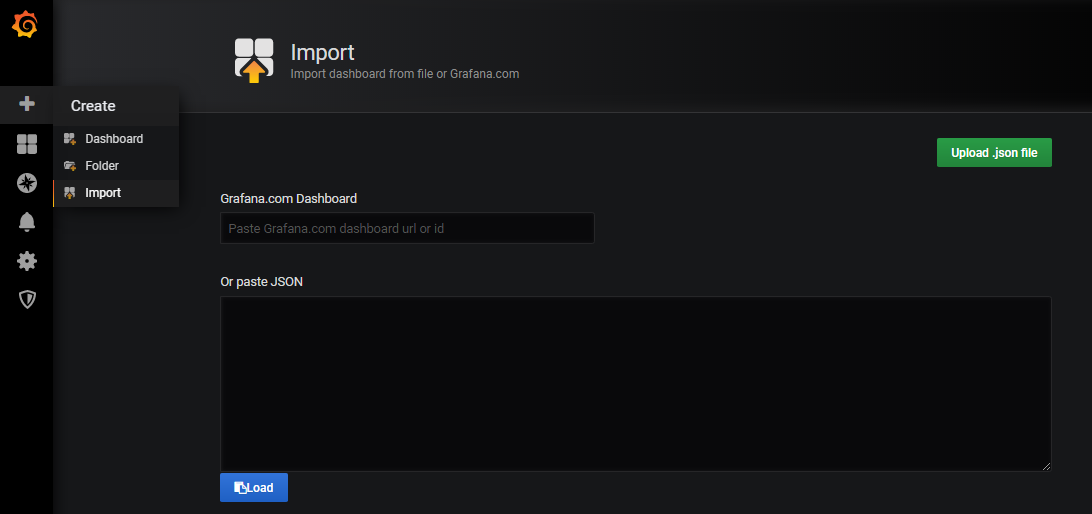
官方模板地址:https://grafana.com/grafana/dashboards,在官方搜索模板后,填入模板id,导入如图:
增加完成后,重新点开模板,这里使用了id:8919的模板,非常炫酷,如图:
四、配置grafana告警
首先配置grafana的smtp,保证邮件服务的支持:
[root@prometheus alertmanager]# vim /etc/grafana/grafana.ini
...
[smtp]
enabled = true
host = smtp.qq.com:25
user = xxxxxxxxx@qq.com
# If the password contains # or ; you have to wrap it with trippel quotes. Ex """#password;"""
password = nqiscvqgbtjrcaid
;cert_file =
;key_file =
skip_verify = true
from_address = xxxxxxxxx@qq.com
from_name = Grafana
...

[root@prometheus alertmanager]# /etc/init.d/grafana-server restart
Restarting grafana-server (via systemctl):                 [  OK  ]
增加一个演示的dashboard,并配置CPU告警,这里需要配置数据源,以及metrics,metrics是直接prometheus上的查询语句出来的指标值,如图:
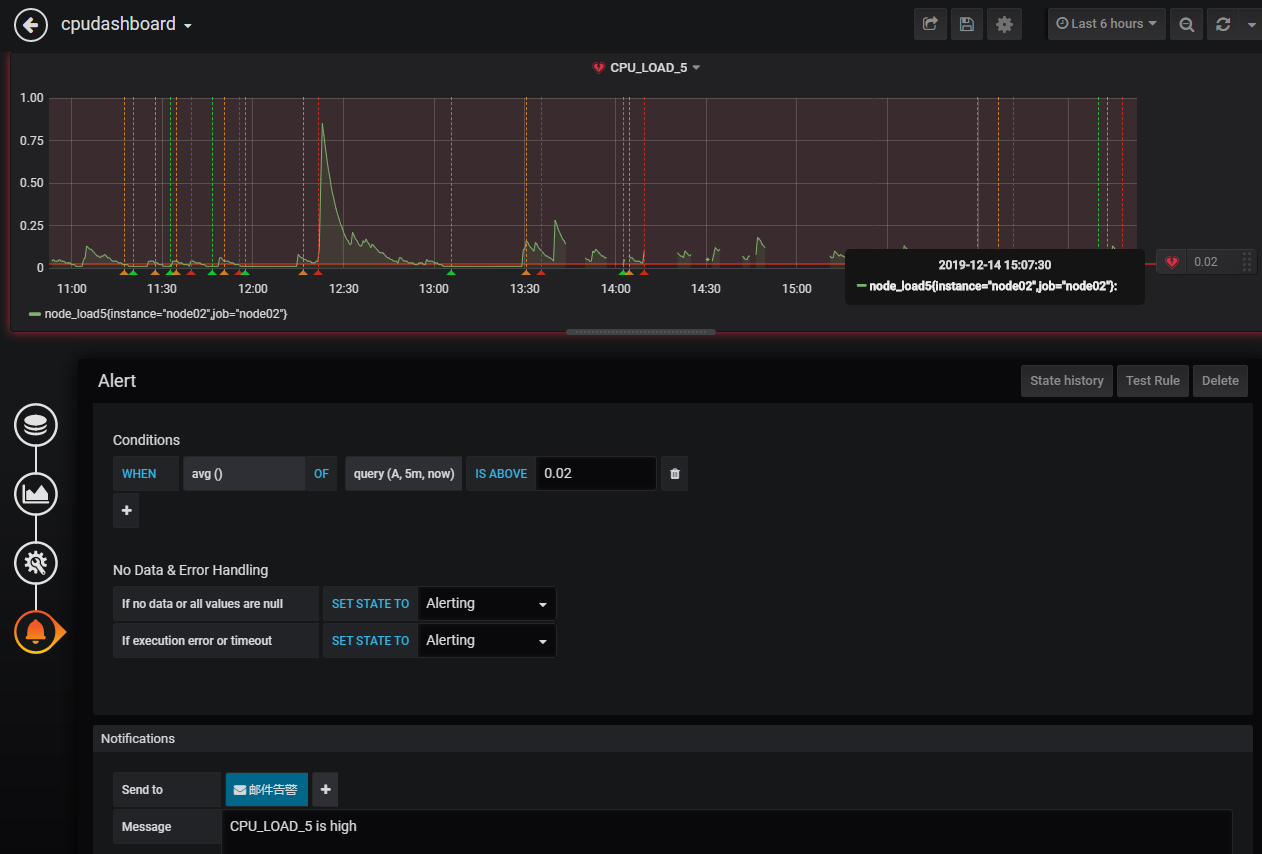
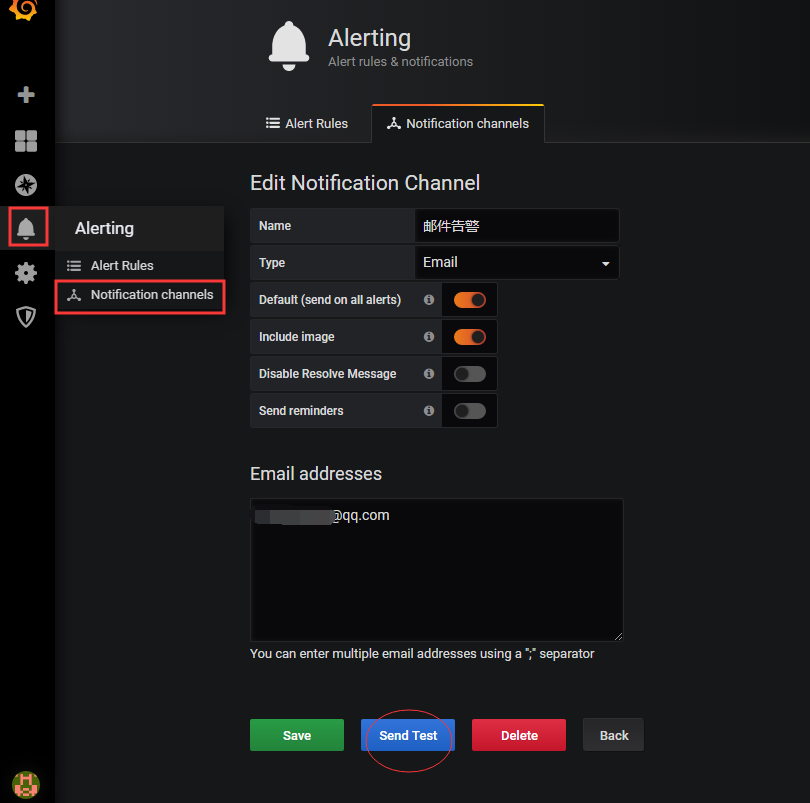
而后配置grafana 中的alert告警配置,填写通知方式:
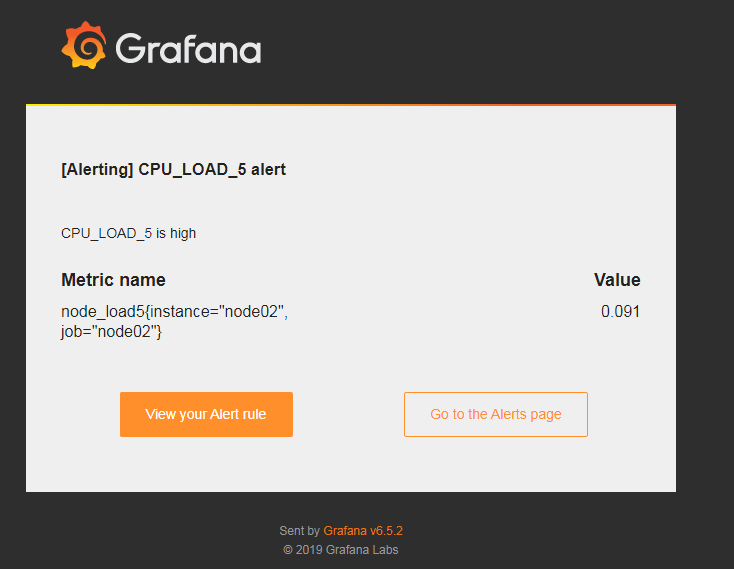
当CPU负载超过我们配置的阈值后,会收到告警信息,如图: