前言
首先我们需要知道tpcc-mysql是干什么的。TPC-C是专门针对联机交易处理系统(OLTP系统)的规范,一般情况下我们也把这类系统称为业务处理系统。tpcc-mysql是percona基于TPC-C(下面简写成TPCC)衍生出来的产品,专用于MySQL基准测试。
Tpcc工具结构
create_table.sql:创建所需的数据库表,共9个表
add_fkey_idx.sql:创建索引和外键
drop_cons.sql:删除约束
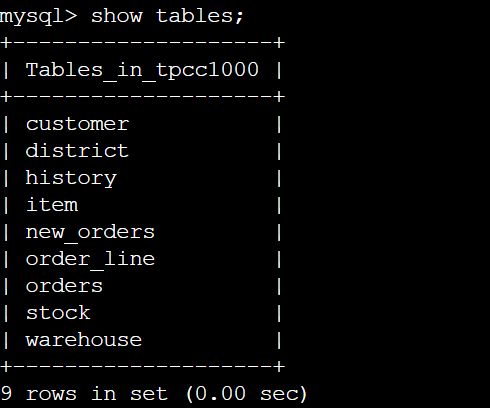
查看可得tpcc1000库中共有9个表。
New-Order:新订单,主要对应 new_orders 表
Payment:支付,主要对应 orders、history 表
Order-Status:订单状态,主要对应 orders、order_line 表
Delivery:发货,主要对应 order_line 表
Stock-Level:库存,主要对应 stock 表
其他相关表:
客户:主要对应 customer 表
地区:主要对应 district 表
商品:主要对应 item 表
仓库:主要对应 warehouse 表
它们的关系:

测试结果分析
(测试过程可见上一篇博客 tpcc-mysql的安装与使用
root@iZj6c9c6vaqj1i0a9j7h78Z:/home/admin/tpcc-mysql# ./tpcc_start -h 127.0.0.1 -p 3306 -d tpcc1000 -u root -p "123123" -w 10 -c 10 -r 100 -l 300 -i 20***************************************
*** ###easy### TPC-C Load Generator ***
***************************************
option h with value '127.0.0.1'
option p with value '3306'
option d with value 'tpcc1000'
option u with value 'root'
option p with value '123123'
option w with value '10'             //仓库数,必须和tpcc_load一致
option c with value '10'             //连接数,可认为是线程数
option r with value '100'            //预热时间,
option l with value '300'            //测试执行时间
option i with value '20'             //产生报告的时间间隔
<Parameters>
     [server]: 127.0.0.1
     [port]: 3306
     [DBname]: tpcc1000
       [user]: root
       [pass]: 123123  [warehouse]: 10
 [connection]: 10
     [rampup]: 100 (sec.)
    [measure]: 300 (sec.)
每20秒输出一次测压数据
RAMP-UP TIME.(100 sec.)     //预热时间

MEASURING START.


  20, trx: 1365, 95%: 149.731, 99%: 192.421, max_rt: 375.631, 1366|268.017, 136|94.819, 135|602.898, 137|623.414
  40, trx: 1327, 95%: 155.906, 99%: 201.499, max_rt: 317.556, 1325|253.945, 133|77.330, 134|546.059, 133|349.548
  60, trx: 1311, 95%: 159.541, 99%: 209.119, max_rt: 395.578, 1313|351.806, 131|91.413, 130|647.841, 131|353.075
  80, trx: 1317, 95%: 155.766, 99%: 195.498, max_rt: 317.046, 1318|223.747, 133|140.812, 133|455.009, 131|322.756
 100, trx: 1308, 95%: 155.812, 99%: 187.812, max_rt: 288.880, 1307|180.816, 130|72.554, 130|494.693, 131|345.204
 120, trx: 1303, 95%: 159.493, 99%: 197.853, max_rt: 279.193, 1305|167.328, 131|148.294, 130|529.679, 131|335.480
 140, trx: 1312, 95%: 159.780, 99%: 212.272, max_rt: 313.500, 1313|228.049, 131|87.855, 132|649.486, 130|318.453
 160, trx: 1289, 95%: 160.980, 99%: 198.031, max_rt: 258.698, 1290|203.181, 129|144.156, 129|522.998, 129|372.766
 180, trx: 1281, 95%: 160.307, 99%: 191.330, max_rt: 278.490, 1282|148.655, 128|92.722, 129|589.544, 128|352.993
 200, trx: 1261, 95%: 166.868, 99%: 201.258, max_rt: 306.342, 1257|177.165, 126|133.080, 125|427.867, 126|295.709
 220, trx: 1308, 95%: 153.728, 99%: 186.914, max_rt: 275.757, 1306|243.364, 130|62.822, 131|477.343, 133|367.932
 240, trx: 1286, 95%: 157.359, 99%: 196.731, max_rt: 304.550, 1291|135.553, 129|80.425, 129|440.484, 128|411.228
 260, trx: 1286, 95%: 162.627, 99%: 204.905, max_rt: 248.939, 1287|209.698, 129|104.292, 128|490.073, 128|321.475
 280, trx: 1298, 95%: 162.919, 99%: 208.806, max_rt: 320.564, 1291|157.251, 130|76.880, 130|572.787, 129|329.122
 300, trx: 1290, 95%: 161.173, 99%: 199.578, max_rt: 378.012, 1296|177.117, 129|129.114, 130|489.317, 129|378.575
STOPPING THREADS..........
分析:
- 以逗号分隔,共6列
- 第一列,上面设置的时间间隔,20秒
- 第二列, 20秒内执行新订单交易次数,13651次,即这段时间内的吞吐量
- 第三列,95% 新订单交易平均响应时间,149.731秒
- 第四列,99% 新订单交易平均响应时间,192.421秒
- 第五列,新订单交易最长响应时间为375.631秒
- 第五列,支付业务的结果,吞吐量|最大相应时间
- 第六列,发货业务的结果
- 第六列,库存业务的结果
<Raw Results>              //第一次统计结果
  [0] sc:0 lt:19542  rt:0  fl:0 avg_rt: 110.7 (5)        //新订单
  [1] sc:253 lt:19294  rt:0  fl:0 avg_rt: 36.8 (5)       //支付
  [2] sc:563 lt:1392  rt:0  fl:0 avg_rt: 21.6 (5)        //订单查询
  [3] sc:0 lt:1955  rt:0  fl:0 avg_rt: 316.7 (80)         //发货
  [4] sc:18 lt:1936  rt:0  fl:0 avg_rt: 233.9 (20)        //库存
 in 300 sec.

<Raw Results2(sum ver.)>   //第二次统计结果
  [0] sc:0  lt:19542  rt:0  fl:0
  [1] sc:253  lt:19294  rt:0  fl:0
  [2] sc:563  lt:1392  rt:0  fl:0
  [3] sc:0  lt:1955  rt:0  fl:0
  [4] sc:18  lt:1936  rt:0  fl:0
分析:
汇总各种业务各状态的数据量
- sc: success, 操作成功的数量
- rt: retry, 操作重试的数量
- fl: failure,操作失败的数量
- avg_rt,平均重试次数
<Constraint Check> (all must be [OK])
 [transaction percentage]         //每种交易的占比
        Payment: 43.48% (>=43.0%) [OK]       //支付成功次数(上述统计结果中 sc + lt)  必须大于43.0%,否则结果为NG,而不是OK
   Order-Status: 4.35% (>= 4.0%) [OK]        // 订单状态
       Delivery: 4.35% (>= 4.0%) [OK]        //发货
    Stock-Level: 4.35% (>= 4.0%) [OK]        //库存
 [response time (at least 90% passed)]  //各种交易的响应时间
      New-Order: 0.00%  [NG] *              //正常情况一下5个都应是[OK],我用的阿里云1G1h比较辣鸡
        Payment: 1.29%  [NG] *
   Order-Status: 28.80%  [NG] *
       Delivery: 0.00%  [NG] *
    Stock-Level: 0.92%  [NG] *

<TpmC>
                 3908.400 TpmC           //TpmC结果值(每分钟事务数,该值是第一次统计结果中的新订单事务数除以总耗时分钟数,例如本例中是:19542/5=3908.4)
//tpmC值在国内外被广泛用于衡量计算机系统的事务处理能力
如果您将输出结果导入到了文件,例如
./tpcc_start -h 127.0.0.1 -p 3306 -d tpcc1000 -u root -p "123456" -w 10 -c 10 -r 100 -l 300 -i 20 -f /var/log/tpcc_mysql.log -t /var/log/tpcc_mysql.rtx
tpcc_mysql.log的内容如下:
0 101.848
0 168.824
0 258.733
0 257.668
0 268.181
......
280 89.286          //280表示timestamp,89.286表示当前新订单业务耗时89.286s
280 106.604
280 111.706
300 54.267
300 73.795
300 73.921
tpcc_mysql.rtx的内容如下:
t_num: 6 finish: 1555510718 176127461 start: 1555510718 111539482
t_num: 2 finish: 1555510718 226665914 start: 1555510718 147639779
t_num: 0 finish: 1555510718 229816369 start: 1555510718 135469427
t_num: 4 finish: 1555510718 234458797 start: 1555510718 161088595
t_num: 1 finish: 1555510718 248017799 start: 1555510718 149352990
t_num: 8 finish: 1555510718 252816208 start: 1555510718 163539810
t_num: 9 finish: 1555510718 280146373 start: 1555510718 173552637
t_num: 6 finish: 1555510718 287838904 start: 1555510718 176143349
......
分析:
t_num表示第几个线程
start表示这笔新订单发送的起始时间,finish表示订单的结束时间,注意这个时间指的是占用CPU时间,其实订单完成时间很大一部分消耗在磁盘的IO处理上。
除了MySQL的输出日志之外,还需要关心系统的性能指标,因此需要借助iostat、vmstat等系统工具,查看系统的性能特征。scripts中有很多工具脚本(不会用555)
参考链接:
1. tpcc-mysql安装、使用、结果解读 https://yq.aliyun.com/articles/178251
2. tpcc-mysql使用及输出结果解读 https://blog.csdn.net/cnhome/article/details/42420869
3. 测试结果图表化 https://www.hi-linux.com/posts/38534.html