import matplotlib.pyplot as plt
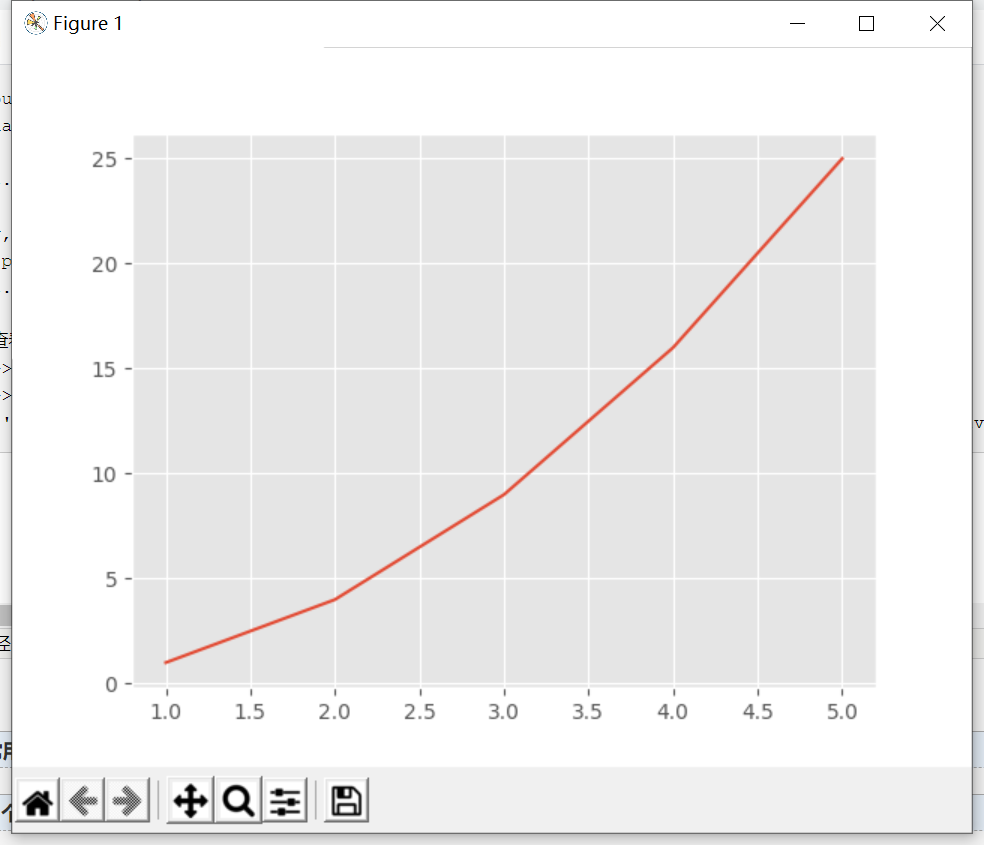
input_values = [1,2,3,4,5]
squares = [1,4,9,16,25]
plt.style.use('ggplot') # 绘制图表时使用款式ggplot
fig,ax = plt.subplots()
ax.plot(input_values,squares)
plt.show()
# 查看当前支持的款式
# >>> import matplotlib.pyplot as plt
# >>> plt.style.available
# ['Solarize_Light2', '_classic_test_patch', 'bmh', 'classic', 'dark_background', 'fast', 'fivethirtyeight', 'ggplot', 'grayscale', 'seaborn', 'seaborn-bright', 'seaborn-colorblind', 'seaborn-dark', 'seaborn-dark-palette', 'seaborn-darkgrid', 'seaborn-deep', 'seaborn-muted', 'seaborn-notebook', 'seaborn-paper', 'seaborn-pastel', 'seaborn-poster', 'seaborn-talk', 'seaborn-ticks', 'seaborn-white', 'seaborn-whitegrid', 'tableau-colorblind10']