代码:
%% ------------------------------------------------------------------------
%%            Output Info about this m-file
fprintf('
***********************************************************
');
fprintf('        <DSP using MATLAB> Exameple 9.2

');

time_stamp = datestr(now, 31);
[wkd1, wkd2] = weekday(today, 'long');
fprintf('      Now is %20s, and it is %7s

', time_stamp, wkd2);
%% ------------------------------------------------------------------------

n = 0:2048; k1 = 256; k2 = k1+32; m = 0:(k2-k1);


%% -----------------------------------------------------------------
%%                             Plot
%% -----------------------------------------------------------------
Hf1 = figure('units', 'inches', 'position', [1, 1, 9, 7], ...
	'paperunits', 'inches', 'paperposition', [0, 0, 6, 4], ...
	'NumberTitle', 'off', 'Name', 'Exameple 9.2');
set(gcf,'Color','white');

TF = 10;
% (a) Original signal
x = cos(0.125*pi*n); subplot(2, 2, 1);
Ha = stem(m, x(m+k1+1), 'g', 'filled'); axis([-1, 33, -1.1, 1.1]); grid on;
set(Ha, 'markersize', 2); xlabel('n'); ylabel('Amplitude');
title('Original Sequence x(n)', 'fontsize', TF);
set(gca, 'xtick', [0, 16, 32]);
set(gca, 'ytick', [-1, 0, 1]);

% (b) Decimation by D = 2
D = 2; y = decimate(x, D); subplot(2, 2, 2);
Hb = stem(m, y(m+k1/D+1), 'c', 'filled'); axis([-1, 33, -1.1, 1.1]); grid on;
set(Hb, 'markersize', 2); xlabel('n'); ylabel('Amplitude');
title('Decimated by D = 2', 'fontsize', TF);
set(gca, 'xtick', [0, 16, 32]);
set(gca, 'ytick', [-1, 0, 1]);

% (c) Decimation by D = 4
D = 4; y = decimate(x, D); subplot(2, 2, 3);
Hc = stem(m, y(m+k1/D+1), 'r', 'filled'); axis([-1, 33, -1.1, 1.1]); grid on;
set(Hc, 'markersize', 2); xlabel('n'); ylabel('Amplitude');
title('Decimated by D = 4', 'fontsize', TF);
set(gca, 'xtick', [0, 16, 32]);
set(gca, 'ytick', [-1, 0, 1]);

% (d) Decimation by D = 8
D = 8; y = decimate(x, D); subplot(2, 2, 4);
Hd = stem(m, y(m+k1/D+1), 'm', 'filled'); axis([-1, 33, -1.1, 1.1]); grid on;
set(Hd, 'markersize', 2); xlabel('n'); ylabel('Amplitude');
title('Decimated by D = 8', 'fontsize', TF);
set(gca, 'xtick', [0, 16, 32]);
set(gca, 'ytick', [-1, 0, 1]);
运行结果:
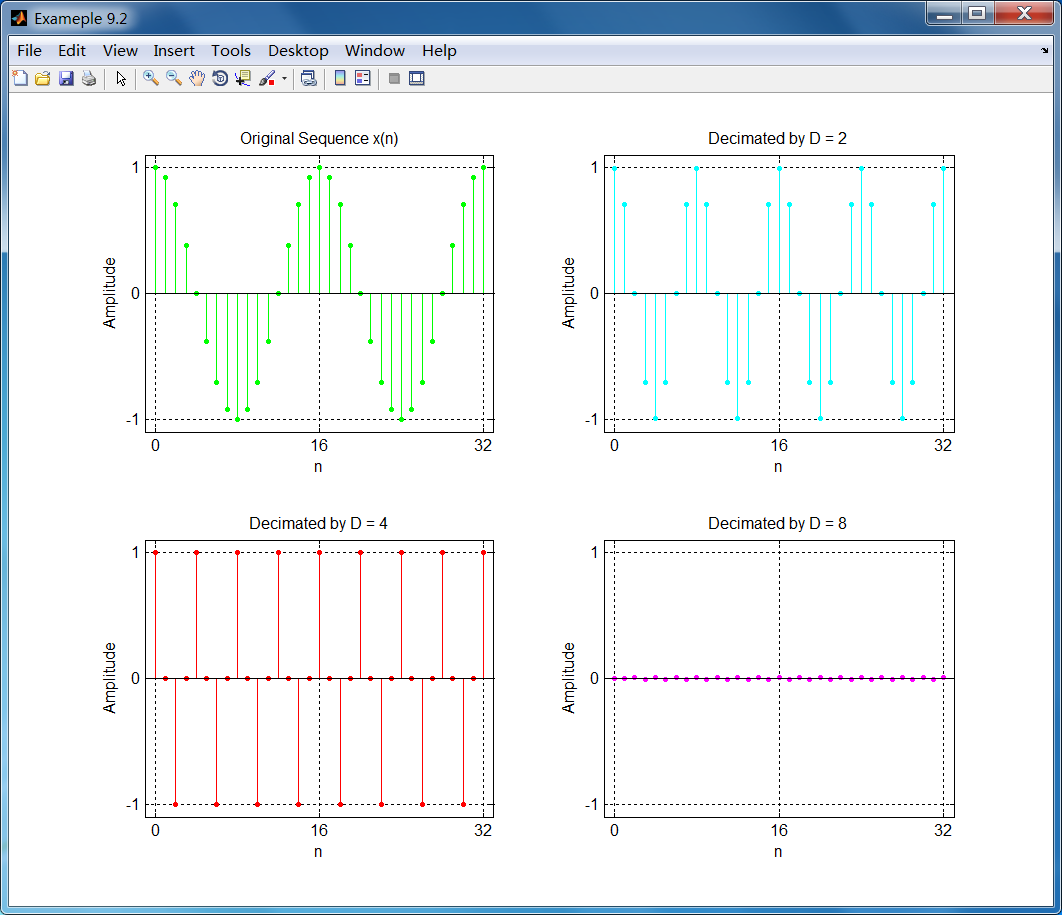
我们将画出信号的中间段,来避免默认低通滤波器的末端效应。默认低通采样8阶切比雪夫I型,截止频率0.8π/D(本例子来说分别是0.4π、0.2π和0.1π三个截止频率。)
从图中看出,按D=2和D=4减采样序列是正确的,在低采样率情况下展示了原始正弦序列x(n);但是,D=8的序列几乎为零,原因就是首先对输入序列进行低通,然后再
减采样。MATLAB中decimat函数使用低通的截止频率为0.1π,原始信号0.125π几乎消减没了。