Here is a demo,


private void Form1_Load(object sender, EventArgs e)
{
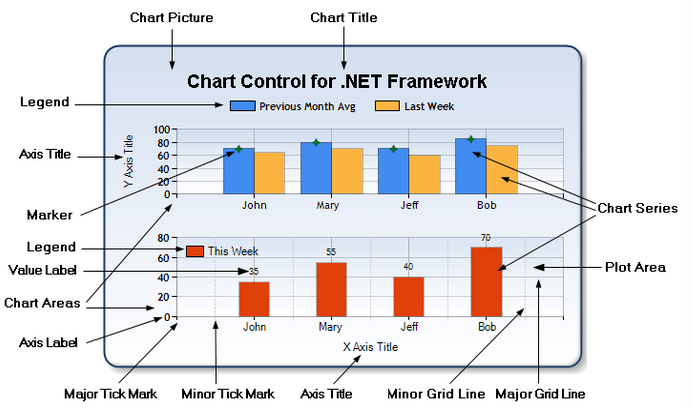
chart1.Titles.Add("New Title");
chart1.ChartAreas[0].Axes[0].MajorGrid.Enabled = false;
chart1.ChartAreas[0].Axes[1].MajorGrid.Enabled = false;
List<int> x = new List<int> { 1, 2, 3, 4, 5 };
List<int> l1 = new List<int> { 10, 20, 30, 40, 50 };
List<int> l2 = new List<int> { 10, 15, 20, 25, 30 };
List<int> l3 = new List<int> { 20, 15, 35, 40, 10 };
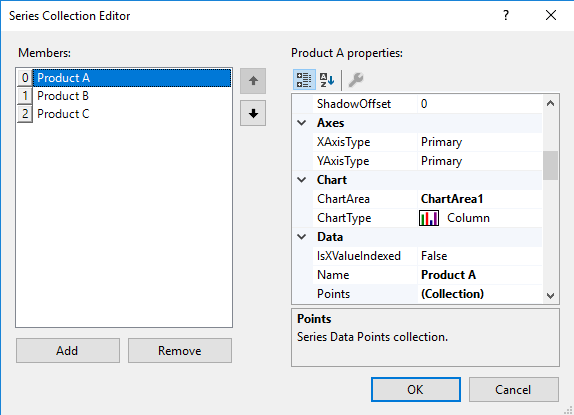
chart1.Series["Product A"].Points.DataBindXY(x, l1);
chart1.Series["Product B"].Points.DataBindXY(x, l2);
chart1.Series["Product C"].Points.DataBindXY(x, l3);
chart1.Series[0].ChartType = SeriesChartType.Column;
chart1.Series[1].ChartType = SeriesChartType.Column;
chart1.Series[2].ChartType = SeriesChartType.Column;
}
The way to set Series,
Other reference: https://www.cnblogs.com/Betty-IT/p/9198557.html