What is Spark
Apache Spark is a cluster computing framework, similar to Apache Hadoop. Wikipedia has a great description of it:
Apache Spark is an open source cluster computing framework originally developed in the AMPLab at University of California, Berkeley but was later donated to the Apache Software Foundation where it remains today. In contrast to Hadoop’s two-stage disk-based MapReduce paradigm, Spark’s multi-stage in-memory primitives provides performance up to 100 times faster for certain applications. By allowing user programs to load data into a cluster’s memory and query it repeatedly, Spark is well-suited to machine learning algorithms.

In contrast to popular belief, Spark does not require all data to fit into memory but will use caching to speed up the operations (just like MySQL). Spark can also run in standalone mode and does not require Hadoop; it can also be run on a single server (or even laptop or desktop) and utilize all your CPU cores.
Starting it in a distributed mode is really easy. Start the “master” first. You can run the “slave” on the same node:
| root@thor:~/spark# ./sbin/start-master.sh less ../logs/spark-root-org.apache.spark.deploy.master.Master-1-thor.out 15/08/25 11:21:21 INFO Master: Starting Spark master at spark://thor:7077 15/08/25 11:21:21 INFO Master: Running Spark version 1.4.1 15/08/25 11:21:21 INFO Utils: Successfully started service 'MasterUI' on port 8080. 15/08/25 11:21:21 INFO MasterWebUI: Started MasterWebUI at http://10.60.23.188:8080 root@thor:~/spark# ./sbin/start-slave.sh spark://thor:7077 |
Then run Spark Worker on any additional nodes (make sure to add the hostname to /etc/hosts or use DNS):
| root@d31:~/spark# ./sbin/start-slave.sh spark://thor:7077 |
Why Spark and Not MySQL?
There are a number of tasks where MySQL (out-of-the-box) does not show great performance. One of the MySQL limitations is: 1 query = 1 cpu core. It means that even if you have 48 fast cores and a large dataset to process (i.e. group by, sort, etc) it will not utilize the full computing power. Spark, on the contrary, will be able to utilize all your CPU cores.
Another difference between MySQL and Spark:
- MySQL uses so called “schema on write” – it will need the data to be converted into MySQL. If our data is not inside MySQL you can’t use “sql” to query it.
- Spark (and Hadoop/Hive as well) uses “schema on read” – it can apply a table structure on top of a compressed text file, for example, (or any other supported input format) and see it as a table; then we can use SQL to query this “table.”
In other words, MySQL is storage+processing while Spark’s job is processing only, and it can pipe data directly from/toexternal datasets, i.e., Hadoop, Amazon S3, local files, JDBC (MySQL/other databases). Spark supports text files (compressed), SequenceFiles, and any other Hadoop InputFormat as well as Parquet Columnar storage. Spark is more flexible in this regard compared to Hadoop: Spark can read data directly from MySQL, for example.
The typical pipeline to load external data to MySQL is:
- Uncompress (typically the external data is in compressed text files)
- Load it into MySQL’s staging table with “LOAD DATA INFILE”
- Only then we can filter/group by and save the result in another table
That can cause additional overhead. In many cases we do not need the “raw” data but we still have to load it into MySQL.
Why Spark Together With MySQL
On the contrary, the result of our analysis (i.e. aggregated data) should be in MySQL. It does not have to be, but it is much more convenient to store the result of your analysis in MySQL. Let’s say you want to analyze a big dataset (i.e. year to year sales comparison) and you will need to present it in the form of a table or graph. The result set will be significantly smaller as it will be aggregated and it will be much easier to store it in MySQL as many standard applications will work with that.
Real World Test Case
One of interesting free datasets is Wikipedia Page Counts. (>1TB compressed, available since 2008). This data can be downloaded (as gzipped space delimited text files) and is also available (limited dataset) on AWS. The data is aggregated by the hour and has the following fields:
- project (i.e. “en”, “fr”, etc, which is usually a language)
- title of the page (uri), urlencoded
- number of requests
- size of the content returned
(the date field is encoded inside the filename, 1 file per hour)
Our goal will be to find the top 10 pages by the number of requests per day in English Wikipedia, but also to support searching for an arbitrary word so we can show how, for example, the number of requests for the wikipedia article about “myspace” will compare to the article about “facebook” (2008 to 2015).
To do that in MySQL we will have to load it as is into MySQL. The files are distributed with the date part encoded. The uncompressed size of all files is > 10TB. Here are the possible steps (as per our typical MySQL pipeline):
- Uncompress the file and run “LOAD DATA INFILE” into a staging (temporary) table:
| load data local infile '$file' into table wikistats.wikistats_full CHARACTER SET latin1 FIELDS TERMINATED BY ' ' (project_name, title, num_requests, content_size) set request_date = STR_TO_DATE('$datestr', '%Y%m%d %H%i%S'); |
- Aggregate with “insert into” a final table
| insert into wikistats.wikistats_by_day select date(request_date) as request_day, title, count(*), sum(num_requests) from wikistats.wikistats_full group by request_day, title; |
- Somehow url decode the title (may be using UDF).
This is a big overhead. We will uncompress and transform the data into MySQL just to discard most if it.
According to my calculations it should take > 1 month to do the whole pipeline for 6 years of data (this time does not include the uncompress time and does not include the load time depreciation as the table get bigger and bigger and indexes need to be updated). There are a lots of things we can do here to speed it up of course, i.e., load into different MySQL instances, load into MEMORY table first, then group by into InnoDB, etc.
But one of the easiest ways here will be using Apache Spark and Python script (pyspark). Pyspark can read the original gziped text files, query those text files with SQL, apply any filters, functions, i.e. urldecode, group by day and save the resultset into MySQL.
Here is the Python script to perform those actions:
1 2 3 4 5 6 7 8 9 10 11 12 13 14 15 16 17 18 19 20 21 22 23 24 25 26 27 28 29 30 31 32 33 34 35 | from pyspark import SparkContext sc=SparkContext() # sc is an existing SparkContext. from pyspark.sql import SQLContext, Row sqlContext = SQLContext(sc) import urllib from datetime import timedelta, date def load_day(filename, mydate): # Load a text file and convert each line to a Row. lines = sc.textFile(filename) parts = lines.map(lambda l: l.split(" ")).filter(lambda line: line[0]=="en").filter(lambda line: len(line)>3).cache() wiki = parts.map(lambda p: Row(project=p[0], url=urllib.unquote(p[1]).lower(), num_requests=int(p[2]), content_size=int(p[3]))) #wiki.count() # Infer the schema, and register the DataFrame as a table. schemaWiki = sqlContext.createDataFrame(wiki) schemaWiki.registerTempTable("wikistats") group_res = sqlContext.sql("SELECT '"+ mydate + "' as mydate, url, count(*) as cnt, sum(num_requests) as tot_visits FROM wikistats group by url") # Save to MySQL mysql_url="jdbc:mysql://thor?user=wikistats&password=wikistats" group_res.write.jdbc(url=mysql_url, table="wikistats.wikistats_by_day_spark", mode="append") # Write to parquet file - if needed group_res.saveAsParquetFile("/ssd/wikistats_parquet_bydate/mydate=" + mydate) mount = "/data/wikistats/" d= date(2008, 1, 1) end_date = date(2008, 2, 1) delta = timedelta(days=1) while d < end_date: print d.strftime("%Y-%m-%d") filename=mount + "wikistats//dumps.wikimedia.org/other/pagecounts-raw/2008/2008-01/pagecounts-200801" + d.strftime("%d") + "-*.gz" print(filename) load_day(filename, d.strftime("%Y-%m-%d")) d += delta |
In the script I used Spark to read the original gzip files (1 day at a time). We can use directory as “input” or a list of files. I will then use Resilient Data Set (RDD) transformations; python has lambda functions: map and filter which will allow us to split the “input files” and filter them.
The next step will be to apply the schema (declare fields); here we can also apply any other functions; i.e., I use urllib.unquote to decode the title (urldecode). Finally, we can register the temp table and then use familiar SQL to do the group by.
The script will normally utilize all cpu cores. In addition it is very easy to run it in distributed mode even without Hadoop: just copy the files to all machines in a Spark cluster or use NFS/external storage.
The script took about an hour on 3 boxes to process 1 month of data and load the aggregated data to MySQL (single instance). We can estimate that to load all 6 years (aggregated) to MySQL is ~3 days.
You may now ask, why is it significantly faster (and we still have the result loaded to the same MySQL instance)? The answer is, it is a different, more efficient pipeline. In our original MySQL pipeline (which will probably take months) we load the raw data to MySQL. Here we filter and group on read, and write only what we need to MySQL.
One question may also come up here: do we actually need this whole “pipeline?” Can we simply run our analytical queries on top of the “raw” data? Well, that is possible, but will probably require 1000 nodes Spark Cluster to do it efficiently as it will need to scan through 5TB of data (see “more reading” below).
Multi-treaded Performance for MySQL Inserts
When using group_res.write.jdbc(url=mysql_url, table=”wikistats.wikistats_by_day_spark”, mode=”append”) Spark will use multiple threads to insert into MySQL.
1 2 3 4 5 6 7 8 9 10 11 12 13 14 15 16 17 18 19 20 21 22 23 24 25 26 27 28 29 30 | +------+-----------+------------+-----------+---------+------+--------+--------------------------------------------------------------------------------------------------------+-----------+---------------+ | Id | User | Host | db | Command | Time | State | Info | Rows_sent | Rows_examined | +------+-----------+------------+-----------+---------+------+--------+--------------------------------------------------------------------------------------------------------+-----------+---------------+ | 1050 | root | localhost | wikistats | Query | 0 | init | show processlist | 0 | 0 | | 2133 | wikistats | thor:40994 | NULL | Query | 0 | update | INSERT INTO wikistats.wikistats_by_day_spark VALUES ('2008-01-04', 'Colegio+san+ignacio', 1, 1) | 0 | 0 | | 2134 | wikistats | thor:40995 | NULL | Query | 0 | update | INSERT INTO wikistats.wikistats_by_day_spark VALUES ('2008-01-04', 'Miloš_Crnjanski', 2, 3) | 0 | 0 | | 2135 | wikistats | thor:40996 | NULL | Query | 0 | update | INSERT INTO wikistats.wikistats_by_day_spark VALUES ('2008-01-04', 'Robert_Edgar', 6, 7) | 0 | 0 | | 2136 | wikistats | thor:40997 | NULL | Query | 0 | update | INSERT INTO wikistats.wikistats_by_day_spark VALUES ('2008-01-04', 'Eastern_Orange_Tip', 6, 7) | 0 | 0 | | 2137 | wikistats | thor:40998 | NULL | Query | 0 | update | INSERT INTO wikistats.wikistats_by_day_spark VALUES ('2008-01-04', 'Image:Dresden_Augustusbrücke_Al | 0 | 0 | | 2138 | wikistats | thor:40999 | NULL | Query | 0 | update | INSERT INTO wikistats.wikistats_by_day_spark VALUES ('2008-01-04', 'Diamond_and_pearl', 11, 24) | 0 | 0 | | 2139 | wikistats | thor:41000 | NULL | Query | 0 | update | INSERT INTO wikistats.wikistats_by_day_spark VALUES ('2008-01-04', 'Operation_polo', 2, 2) | 0 | 0 | | 2140 | wikistats | thor:41001 | NULL | Query | 0 | update | INSERT INTO wikistats.wikistats_by_day_spark VALUES ('2008-01-04', 'Template_talk:Edit-first-section | 0 | 0 | | 2141 | wikistats | thor:41002 | NULL | Query | 0 | update | INSERT INTO wikistats.wikistats_by_day_spark VALUES ('2008-01-04', 'Bertha_of_Artois', 1, 1) | 0 | 0 | | 2142 | wikistats | thor:41003 | NULL | Query | 0 | update | INSERT INTO wikistats.wikistats_by_day_spark VALUES ('2008-01-04', 'A Change of Pace', 1, 1) | 0 | 0 | | 2143 | wikistats | thor:41005 | NULL | Query | 0 | update | INSERT INTO wikistats.wikistats_by_day_spark VALUES ('2008-01-04', 'FAIRCHILD-REPUBLIC A-10 THUNDERB | 0 | 0 | | 2144 | wikistats | thor:41006 | NULL | Query | 0 | update | INSERT INTO wikistats.wikistats_by_day_spark VALUES ('2008-01-04', 'Special:Recentchangeslinked/Wiki | 0 | 0 | | 2145 | wikistats | thor:41007 | NULL | Query | 0 | update | INSERT INTO wikistats.wikistats_by_day_spark VALUES ('2008-01-04', 'Image:Carl-sassenrath-sp-1982.jp | 0 | 0 | | 2146 | wikistats | thor:41008 | NULL | Query | 0 | update | INSERT INTO wikistats.wikistats_by_day_spark VALUES ('2008-01-04', 'List_of_Fleet_Air_Arm_aircraft_s | 0 | 0 | | 2147 | wikistats | thor:41009 | NULL | Query | 0 | update | INSERT INTO wikistats.wikistats_by_day_spark VALUES ('2008-01-04', 'Systemic_sclerosis', 17, 29) | 0 | 0 | | 2148 | wikistats | thor:41011 | NULL | Query | 0 | update | INSERT INTO wikistats.wikistats_by_day_spark VALUES ('2008-01-04', 'tataviam', 1, 1) | 0 | 0 | | 2149 | wikistats | thor:41010 | NULL | Query | 0 | update | INSERT INTO wikistats.wikistats_by_day_spark VALUES ('2008-01-04', 'The_Devil_Wears_Prada_(film)#_no | 0 | 0 | | 2150 | wikistats | thor:41013 | NULL | Query | 0 | update | INSERT INTO wikistats.wikistats_by_day_spark VALUES ('2008-01-04', 'Seaford_High_School', 5, 7) | 0 | 0 | | 2151 | wikistats | thor:41014 | NULL | Query | 0 | update | INSERT INTO wikistats.wikistats_by_day_spark VALUES ('2008-01-04', 'Talk:Shocker_(hand_gesture)', 3, | 0 | 0 | | 2152 | wikistats | thor:41015 | NULL | Query | 0 | update | INSERT INTO wikistats.wikistats_by_day_spark VALUES ('2008-01-04', 'Paul_Szabo', 14, 23) | 0 | 0 | | 2153 | wikistats | thor:41016 | NULL | Query | 0 | update | INSERT INTO wikistats.wikistats_by_day_spark VALUES ('2008-01-04', 'ausgereift', 1, 1) | 0 | 0 | | 2154 | wikistats | thor:41017 | NULL | Query | 0 | update | INSERT INTO wikistats.wikistats_by_day_spark VALUES ('2008-01-04', 'Category:March_2005_news', 1, 2) | 0 | 0 | | 2155 | wikistats | thor:41018 | NULL | Query | 0 | update | INSERT INTO wikistats.wikistats_by_day_spark VALUES ('2008-01-04', 'Foot_Locker_Inc', 10, 10) | 0 | 0 | | 2156 | wikistats | thor:41019 | NULL | Query | 0 | update | INSERT INTO wikistats.wikistats_by_day_spark VALUES ('2008-01-04', 'Abbey_Park,_Nottinghamshire', 3, | 0 | 0 | +------+-----------+------------+-----------+---------+------+--------+--------------------------------------------------------------------------------------------------------+-----------+---------------+ 25 rows in set (0.00 sec) |
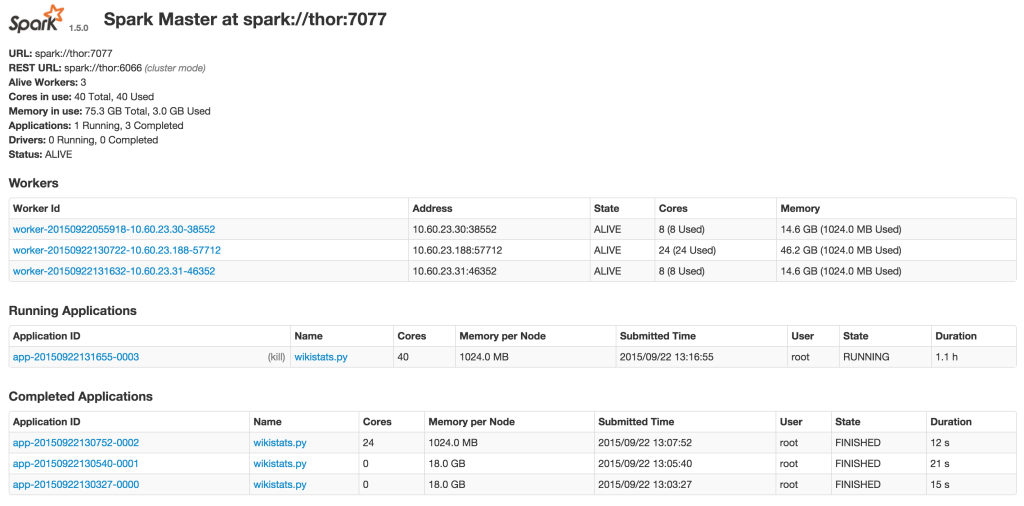
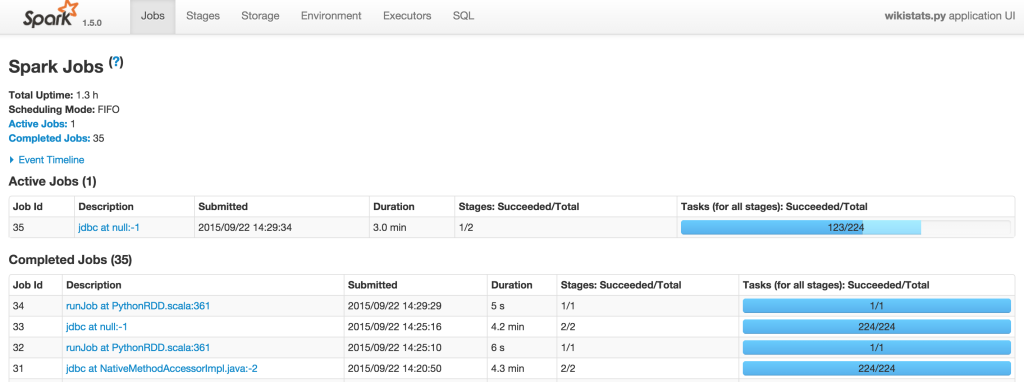
Monitoring your jobs
Spark provides you with a web interface to monitor and manage your job. Here is the example: I’m running the wikistats.py application:
Result: Using Parquet Columnar Format vs MySQL InnoDB table
Spark supports Apache Parquet Columnar format, so we can save RDD as a parquet file (it can be saved to a directory to HDFS):
| group_res.saveAsParquetFile("/ssd/wikistats_parquet_bydate/mydate=" + mydate) |
Here we save the result of our pipeline (aggregated data) into Spark. I also utilize partitioning by day (“mydate=20080101”) and Spark can auto discover partitions in this format.
When I have my results, I want to query it. Let’s say I want to find the top 10 most frequently queried wiki pages in January 2018. I can do this query with MySQL (I will need to filter out main page and search pages):
| mysql> SELECT lower(url) as lurl, sum(tot_visits) as max_visits , count(*) FROM wikistats_by_day_spark where lower(url) not like '%special%' and lower(url) not like '%page%' and lower(url) not like '%test%' and lower(url) not like '%wiki%' group by lower(url) order by max_visits desc limit 10; +--------------------------------------------------------+------------+----------+ | lurl | max_visits | count(*) | +--------------------------------------------------------+------------+----------+ | heath_ledger | 4247338 | 131 | | cloverfield | 3846404 | 131 | | barack_obama | 2238406 | 153 | | 1925_in_baseball#negro_league_baseball_final_standings | 1791341 | 11 | | the_dark_knight_(film) | 1417186 | 64 | | martin_luther_king,_jr. | 1394934 | 136 | | deaths_in_2008 | 1372510 | 67 | | united_states | 1357253 | 167 | | scientology | 1349654 | 108 | | portal:current_events | 1261538 | 125 | +--------------------------------------------------------+------------+----------+ 10 rows in set (1 hour 22 min 10.02 sec) |
Please note, here we are using our already aggregated (summary by data) table, not the “raw” data.
As we can see, the query took 1 hour 22 mins. I have also saved the same results to Parquet (see the script), so now I can use it with Spark-SQL:
| ./bin/spark-sql --master local |
This will use a local version of spark-sql, using 1 host only.
1 2 3 4 5 6 7 8 9 10 11 12 13 14 15 16 17 18 19 20 21 22 23 24 25 | spark-sql> CREATE TEMPORARY TABLE wikistats_parquet USING org.apache.spark.sql.parquet OPTIONS ( path "/ssd/wikistats_parquet_bydate" ); Time taken: 3.466 seconds spark-sql> select count(*) from wikistats_parquet; select count(*) from wikistats_parquet; 227846039 Time taken: 82.185 seconds, Fetched 1 row(s) spark-sql> SELECT lower(url) as lurl, sum(tot_visits) as max_visits , count(*) FROM wikistats_parquet where lower(url) not like '%special%' and lower(url) not like '%page%' and lower(url) not like '%test%' and lower(url) not like '%wiki%' group by lower(url) order by max_visits desc limit 10; heath_ledger 4247335 42 cloverfield 3846400 42 barack_obama 2238402 53 1925_in_baseball#negro_league_baseball_final_standings 1791341 11 the_dark_knight_(film) 1417183 36 martin_luther_king,_jr. 1394934 46 deaths_in_2008 1372510 38 united_states 1357251 55 scientology 1349650 44 portal:current_events 1261305 44 Time taken: 1239.014 seconds, Fetched 10 row(s) |
That took ~20 minutes, which is much faster.
Conclusion
Apache Spark provides a great and easy way to analyze and aggregate data. What I love about Spark vs other big data and analytical frameworks:
- Open-source and actively developed
- No dependency on tools, i.e., the input data and output data does not have to be in Hadoop
- Standalone mode for quick start, easy to deploy
- Massively parallel, easy to add nodes
- Support of variety of input and output format; i.e., it can read/write to MySQL (vs JDBC driver) and Parquet Columnar format
However, there are a number of drawbacks:
- It is still new so you can expect some bugs and undocumented behavior. Many of the errors are hard to explain.
- It requires Java; Spark 1.5 only supports Java 7 and higher. That also means it will require additional memory, which is reasonable nowadays.
- You will need to run jobs through “spark-submit”
I believe Apache Spark is a great tool and can complement MySQL for data analytical and BI purposes.

