1. 回顾
上文讲解了使用Hystrix为Feign添加回退,并通过Fallback Factory检查回退原因以及如何为Feign客户端禁用Hystrix。
2. Hystrix的监控
除实现容错外,Hystrix还提供了近乎实时的监控。HystrixCommand和HystrixObservableCommand在执行时,
会生成执行结果和运行指标,比如每秒执行的请求数、成功数等,这些监控数据对分析应用系统的状态很有用。
使用Hystrix的模块 hystrix-metrics-event-stream ,就可将这些监控的指标信息以 text/event-stream 的格式
暴露给外部系统。spring-cloud-starter-hystrix包含该模块,在此基础上,只须为项目添加spring-boot-starter-actuator,
就可使用 /hystrix.stream 端点获取Hystrix的监控信息了。
> 启动项目 microservice-discovery-eureka
> 启动项目 microservice-provider-user
> 修改项目 microservice-consumer-movie-ribbon-hystrix 的启动类。添加如下方法
/**
 * 低版本直接启动即可使用 http://ip:port/hystrix.stream 查看监控信息
 * 高版本需要添加本方法方可使用 http://ip:port/hystix.stream 查看监控信息
 *
 * @return
 */
@Bean
public ServletRegistrationBean getServlet() {
    HystrixMetricsStreamServlet streamServlet = new HystrixMetricsStreamServlet();
    ServletRegistrationBean registrationBean = new ServletRegistrationBean(streamServlet);
    registrationBean.setLoadOnStartup(1);
    registrationBean.addUrlMappings("/hystrix.stream");
    registrationBean.setName("HystrixMetricsStreamServlet");
    return registrationBean;
}
> 启动项目 microservice-consumer-movie-ribbon-hystrix
> 访问 http://localhost:8010/hystrix.stream,可看到浏览器一直处于请求的状态,页面一直处于请求状态,并一直打印ping。
因为此时项目中注解了 @HystrixCommand 的方法还没有执行,因此也没有任何的监控数据

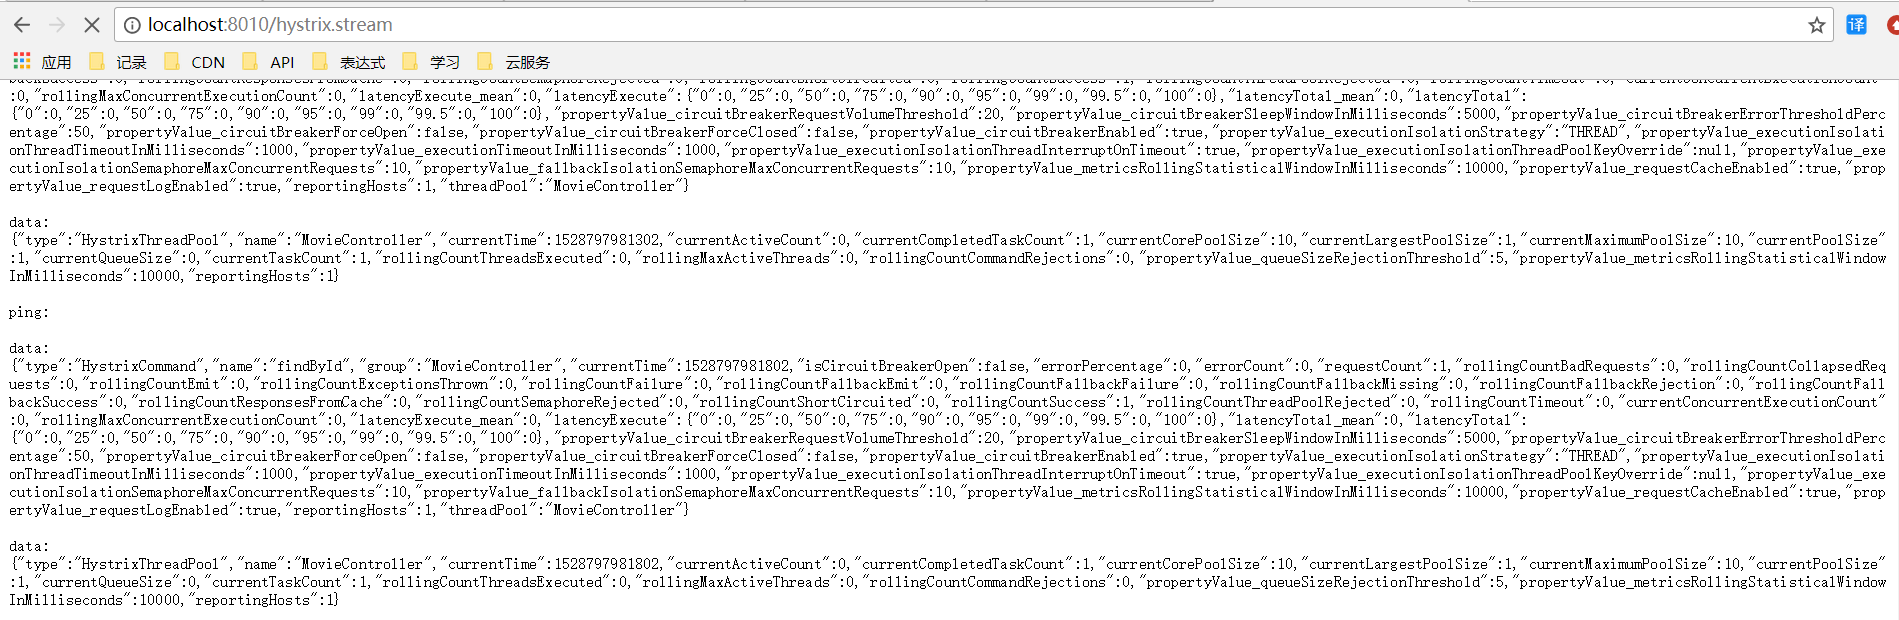
> 访问 http://localhost:8010/user/1 后,再次访问 http://localhost:8010/hystrix.stream,可看到页面会重新出现类似于下面的内容。
因为系统会不断地刷新以获得实时的监控数据。Hystrix的监控指标非常全面,例如HystrixCommand的名称、group名称、
断路器状态、错误率、错误数等。
3. Feign项目的Hystrix监控
启动前文的microservice-consumer-movie-feign-hystrix-fallback项目,并使用类似的方式测试,然后访问 http://localhost:8010/hystrix.stream,
发现返回的是404。这是为什么呢?查看项目的依赖树发现,项目中并没有hystrix-metrics-event-stream的依赖。
解决方案如下:
> 1. 复制项目 microservice-consumer-movie-feign-hystrix-fallback,将ArtifactId修改为 microservice-consumer-movie-feign-hystrix-fallback-stream.
> 2. 为项目添加依赖
<dependency>
    <groupId>org.springframework.cloud</groupId>
    <artifactId>spring-cloud-starter-netflix-hystrix</artifactId>
</dependency>
> 3. 在启动类上添加 @EnableCircuitBreaker ,这样就使用/hystrix.stream端点监控Hystrix了。
4. 总结
本文讲了Hystrix的监控,但是访问/hystrix.stream端点获得的数据是以文字形式展示的。很难通过这些数据,一眼看出系统当前的运行状态。
下文将讲解可视化监控数据。敬请期待~~~
5. 参考
周立 --- 《Spring Cloud与Docker微服务架构与实战》