echarts-detail---饼图

echarts-饼图

  1.饼图上面显示纵坐标的百分比数值
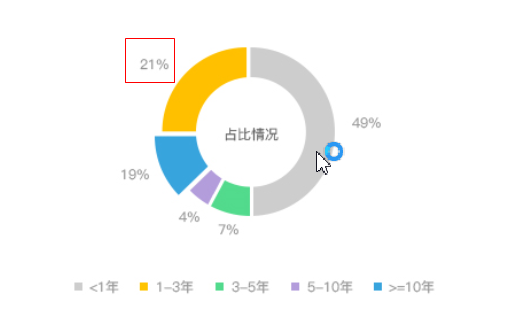
  

           series: [
                    {
                        name: arr[i].name,
                        type: 'pie',
                        radius: ['30%', '50%'],
                        avoidLabelOverlap: false,
                        center: ['40%', '50%'],
                        data: data,
                        selectedMode: 'single',
                         label: {
                             normal: {
                                 formatter: function (item) {
                                     if (!item.percent) {
                                         return ''
                                     } else {
                                         return (item.percent).toFixed(2) + '%)'
                                     }
                                     
                                 }
                             },
                             emphasis: {
                                 show: true,
                                 textStyle: {
                                     fontSize: '14',
                                     fontWeight: 'bold'
                                 }
                             }
                         },
                         labelLine: {
                             normal: {
                                 show: false
                             }
                         },
                        itemStyle: {
                            emphasis: {
                                shadowBlur: 10,
                                shadowOffsetX: 0,
                                shadowColor: 'rgba(0, 0, 0, 0.5)'
                            }
                        }
                    }
                ]
            var result1 = result
            var data = result1
            var data1 = [];
            result.forEach(function (item, index) {
                var itval = {};
                itval.ManageGradeName = item.ManageGradeName
                itval.ManagerCount = item.ManagerCount
                itval.Ratio = item.Ratio
                itval.name = item.name
                itval.value = item.value
                data1.push(itval)
            })
            var sum = _.sumBy(data, 'ManagerCount')
            var ratio = _.sumBy(data, 'Ratio')
            var Name = _.map(data, 'ManageGradeName');
            result1.unshift({
                ManageGradeName: "合计",
                ManagerCount: sum,
                Ratio: '1'
            })
            content.append(compiled({
                'data': data,
                'dom': '<div class="record" id="proportion" style=" 440px; height: 270px; display: inline-block; margin-left:65px;"></div>'
            }))

            _.each(data1, function (item) {
                item.value = item.ManagerCount;
                item.name = item.ManageGradeName;
            })
            var myChart = echarts.init(document.getElementById("proportion"));
            var option = {
                color: gObj.color,//饼图中数据的颜色
                title: {  //饼图的title设置
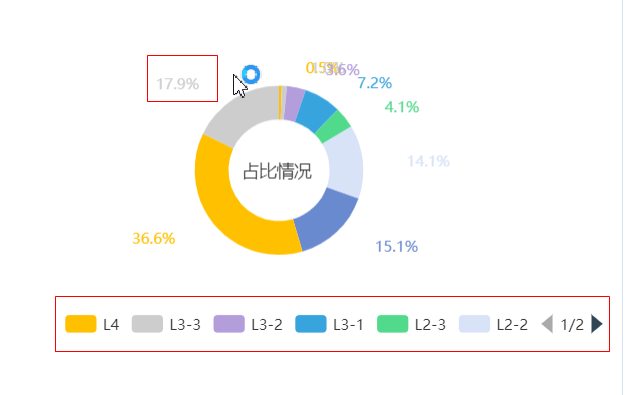
                    text: '占比情况',
                    x: '141px',
                    y: '124px',
                    textStyle: {
                        color: '#333',
                        fontStyle: 'normal',
                        fontWeight: 'normal',
                        fontSize: 14,
                    }
                },
                tooltip: {//鼠标悬浮的提示
                    trigger: 'item',
                    formatter: function (item) {
                        return item.seriesName + ' <br/>' + item.name +
                            ' : ' + item.value + ' (' + (item.value * 100 / sum).toFixed(1) + '%)';
                    }
                },
                legend: { //数据详情在div的位置
                    x: 'center',
                    y: 'bottom',
                    orient: 'horizontal',
                    //bottom: 5,
                    //left: 10,
                    data: Name,
                    type: 'scroll',//
                },
                series: [// 填入饼图中的数据
                    {
                        barWidth: 30,
                        name: '占比',
                        type: 'pie',
                        radius: ['30%', '50%'],
                        avoidLabelOverlap: false,
                        center: ['40%', '50%'],
                        data: data1,
                        selectedMode: 'single',
                        label: {// 数据的格式
                            normal: {
                                formatter: function (item) {
                                    if (!item.percent) {
                                        return ''
                                    } else {
                                        return (item.value * 100 / sum).toFixed(1) + '%'
                                    }
                                }
                            },
                            emphasis: {
                                show: true,
                                textStyle: {
                                    fontSize: '14',
                                    fontWeight: 'bold'
                                }
                            }
                        },
                        labelLine: {
                            normal: {
                                show: false
                            }
                        },
                        itemStyle: {
                            emphasis: {
                                shadowBlur: 10,
                                shadowOffsetX: 0,
                                shadowColor: 'rgba(0, 0, 0, 0.5)'
                            }
                        }
                    }
                ]
            };
            myChart.setOption(option)            
原文地址:https://www.cnblogs.com/jcxfighting/p/7896603.html