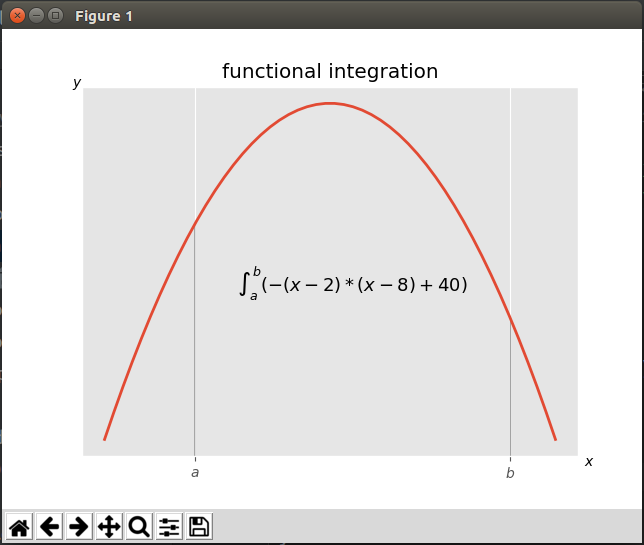
# coding:utf-8

import numpy as np
from matplotlib import pyplot as plt
from matplotlib.patches import Polygon

'''
求函数积分
'''


def func(x):
    return -(x - 2) * (x - 8) + 40


print(plt.style.available)
plt.style.use("ggplot")

# 绘制曲线
x = np.linspace(0, 10)
y = func(x)
fig, ax = plt.subplots()
plt.plot(x, y, linewidth=2)

# 设置坐标轴
a = 2
b = 9
ax.set_xticks([a, b])  # 设置横坐标2,9
ax.set_yticks([])  # 设置纵坐标为空
ax.set_xticklabels(['$a$', '$b$'])  # 设置横坐标显示为a,b
plt.figtext(0.91, 0.09, '$x$')  # 设置坐标轴字母
plt.figtext(0.11, 0.88, '$y$')

# 确定多边形
ix = np.linspace(a, b)
iy = func(ix)
ixy = zip(ix, iy)
verts = [(a, 0)] + list(ixy) + [(b, 0)]
poly = Polygon(verts, facecolor='0.9', edgecolor='0.5')
ax.add_patch(poly)

# 添加数学公式
x_math = (a + b) * 0.5
y_math = 35
plt.text(x_math, y_math, r'$int_a^b(-(x - 2) * (x - 8) + 40)$', fontsize=13, horizontalalignment='center')

plt.title('functional integration')
plt.show()