想看前面整理的canvas常用API的同学可以点下面:
canvas学习之API整理笔记(一)
canvas学习之API整理笔记(二)
本系列文章涉及的所有代码都将上传至:项目代码github地址,喜欢的同学们欢迎点Star~
从本篇文章开始,我会分享给大家canvas绘制的各种基础图形和酷炫的图形,注意:是一系列!欢迎关注!
后续每篇文章我会着重分享给大家一些使用Canvas开发的实例和这些实例的实现思路。
本文看点:使用canvas来绘制常见的各种图形实例,并且会简单封装一下绘制各图形的方法,最后会分享给大家一个封装好的快速绘制多边形的方法。
开始之前
//获取canvas容器
var can = document.getElementById('canvas');
//创建一个画布
var ctx = can.getContext('2d');
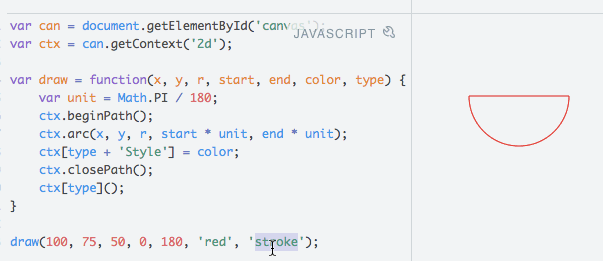
绘制圆形
var draw = function(x, y, r, start, end, color, type) {
    var unit = Math.PI / 180;
    ctx.beginPath();
    ctx.arc(x, y, r, start * unit, end * unit);
    ctx[type + 'Style'] = color;
    ctx.closePath();
    ctx[type]();
}
参数解释:x,y-圆心;start-起始角度;end-结束角度;color-绘制颜色;type-绘制类型('fill'和'stroke')。
实例如下图所示:
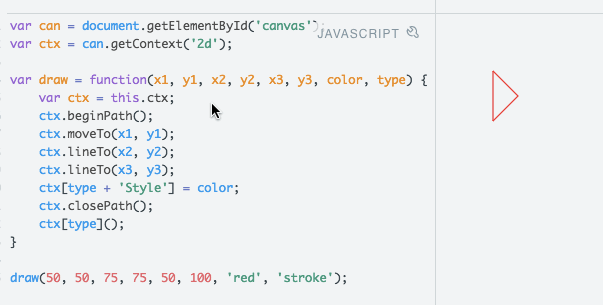
绘制三角形
var draw = function(x1, y1, x2, y2, x3, y3, color, type) {
    ctx.beginPath();
    ctx.moveTo(x1, y1);
    ctx.lineTo(x2, y2);
    ctx.lineTo(x3, y3);
    ctx[type + 'Style'] = color;
    ctx.closePath();
    ctx[type]();
}
参数解释:x1(2、3),y1(2、3)-三角形的三个点的坐标;color-绘制颜色;type-绘制类型('fill'和'stroke')。
实例如下图所示:
绘制(圆角)矩形
var draw = function(x, y, width, height, radius, color, type){
    ctx.beginPath();
    ctx.moveTo(x, y+radius);
    ctx.lineTo(x, y+height-radius);
    ctx.quadraticCurveTo(x, y+height, x+radius, y+height);
    ctx.lineTo(x+width-radius, y+height);
    ctx.quadraticCurveTo(x+width, y+height, x+width, y+height-radius);
    ctx.lineTo(x+width, y+radius);
    ctx.quadraticCurveTo(x+width, y, x+width-radius, y);
    ctx.lineTo(x+radius, y);
    ctx.quadraticCurveTo(x, y, x, y+radius);
    ctx[type + 'Style'] = color || params.color;
    ctx.closePath();
    ctx[type]();
}
参数解释:x,y-左上角点的坐标;width、height-宽高;radius-圆角;color-绘制颜色;type-绘制类型('fill'和'stroke')。
实例如下图所示:

绘制多边形
var drawPolygon = function(ctx, conf){
    var x = conf && conf.x || 0;  //中心点x坐标
    var y = conf && conf.y || 0;  //中心点y坐标
    var num = conf && conf.num || 3;   //图形边的个数
    var r = conf && conf.r || 100;   //图形的半径
    var width = conf && conf.width || 5;
    var strokeStyle = conf && conf.strokeStyle;
    var fillStyle = conf && conf.fillStyle;
    //开始路径
    ctx.beginPath();
    var startX = x + r * Math.cos(2*Math.PI*0/num);
    var startY = y + r * Math.sin(2*Math.PI*0/num);
    ctx.moveTo(startX, startY);
    for(var i = 1; i <= num; i++) {
        var newX = x + r * Math.cos(2*Math.PI*i/num);
        var newY = y + r * Math.sin(2*Math.PI*i/num);
        ctx.lineTo(newX, newY);
    }
    ctx.closePath();
    //路径闭合
    if(strokeStyle) {
        ctx.strokeStyle = strokeStyle;
        ctx.lineWidth = width;
        ctx.lineJoin = 'round';
        ctx.stroke();
    }
    if(fillStyle) {
        ctx.fillStyle = fillStyle;
        ctx.fill();
    }
}
参数说明:
ctx: canvas画布
conf: 配置项,提供以下一些配置
- x: 中心点横坐标
- y: 中心点纵坐标
- num: 多边形的边数
- r:多边形的半径长度
- width:多边形线的宽度
- strokeStyle:边线的颜色
- fillStyle:填充的颜色

上图效果的代码如下:
上图1的代码:
drawPolygon(ctx, {
    num: 6,
    r: 100,
    strokeStyle: 'blue',
    fillStyle: '#9da'
})
上图2的代码:
drawPolygon(ctx, {
    num: 4,
    r: 150,
    strokeStyle: 'red',
     4
})
上图3的代码:
drawPolygon(ctx, {
    x: 800,
    y: 250,
    num: 10,
    fillStyle: '#000'
})
结语
我们总结一下,使用canvas绘制图形就是那几个函数:beginPath、arc、moveTo、lineTo、closePath、fill、stroke。当我们能够熟练掌握并运用自如的时候,就能够独当一面了。加油吧,骚年们!
本文涉及的代码我已经上传至github,项目代码github地址,喜欢的同学点个Star,多谢多谢~