filebeat安装dashboard
参考: https://www.elastic.co/guide/en/beats/filebeat/current/filebeat-getting-started.html
发现安装时候报错
./filebeat setup --dashboards
./filebeat -e --modules nginx
./filebeat -e --modules system,nginx,mysql
解决: vim filebeat.yaml 仅仅写入下面内容后再执行. es和kiban的dashboard自动导入,kibana会自动创建filebeat-*索引.
output.elasticsearch:
    hosts: ["http://192.168.x.x:9200"]
    setup.dashboards.enabled: true
    template.enabled: true
    template.path: "filebeat.template.json"
    template.overwrite: true
dashboards.enabled: true
logstash file模块时间参数设置
logstash综合案例参考:
http://blog.csdn.net/qq1032355091/article/details/52953837
input {
    file {
        type => "tradelog"
        path => "/var/log/maotai.log*"
        discover_interval => 5
        start_position => "beginning"

        sincedb_path => "/home/elk/myconf/maotai.txt"
        sincedb_write_interval => 15

        codec => plain { charset => "GB2312" }
    }
}
input file参数说明:
-
- start_position:设置beginning保证从文件开头读取数据。
-
- path:填入文件路径。
-
- type:自定义类型为tradelog,由用户任意填写。
-
- codec:设置读取文件的编码为GB2312,用户也可以设置为UTF-8等等
-
- discover_interval:每隔多久去检查一次被监听的 path 下是否有新文件,默认值是15秒
-
- sincedb_path:设置记录源文件读取位置的文件,默认为文件所在位置的隐藏文件。
-
- sincedb_write_interval:每隔15秒记录一下文件读取位置
logstash ua和geoip插件使用
ua参考:
https://www.cnblogs.com/Orgliny/p/5755384.html
if [message] !~ "^127.|^192.168.|^172.1[6-9].|^172.2[0-9].|^172.3[01].|^10." {    #排除私网地址
  geoip {
    source => "message"    #设置解析IP地址的字段
    target => "geoip"    #将geoip数据保存到一个字段内
    database => "/usr/share/GeoIP/GeoLite2-City.mmdb"    #IP地址数据库
  }
}
start_position参数,begging默认从sincedb记录点开始读
start_position默认end,即从文件尾开始读.
如果设置为beginning,每次启动从文件(sincedb记录点)开始读取
$ cat pipline-startposition.conf
input {
    file{
        path => "/tmp/a.txt"
        start_position => 'beginning'
        codec => "json"
    }
}
output {
    stdout { codec => rubydebug }
}

rm -f data/plugins/inputs/file/.sincedb_*
bin/logstash -f pipline-startposition.conf
pipline-logstash-simple.conf
参考: https://www.kancloud.cn/hanxt/elk/155901
input { stdin { } }
output {
  elasticsearch { hosts => ["localhost:9200"] }
  stdout { codec => rubydebug }
}
logstash例子
参考: https://www.elastic.co/guide/en/logstash/current/configuration.html
$ cat first-pipeline.conf
input {
    beats {
        port => "5043"
    }
    file{
        path => "/var/log/nginx/access.log"
        start_position => 'beginning'
        codec => "json"
    }
}


# The filter part of this file is commented out to indicate that it is
# optional.
# filter {
#
# }
output {
    stdout { codec => rubydebug }
    elasticsearch {
        hosts => [ "localhost:9200" ]
    }
}
filebeat的一个语法
filebeat:
  prospectors:
    - input_type: log
      paths:
        - "/tmp/a.txt"
      document_type: a-txt

    - input_type: log
      paths:
         - "/tmp/b.txt"
         - "/tmp/c.txt"
      document_type: bc-txt
output:
  logstash:
    enabled: true
    hosts: ["192.168.6.103:5001"]
    index: logstash
logstash exec输入输出
参考: https://www.elastic.co/guide/en/logstash/current/first-event.html
bin/logstash -e 'input { stdin { } } stdout { codec => rubydebug } }'
遇到这个问题:
2016-05-09T23:27:31.810Z %{host} %{message}

因为之前写成了这样,所以报错
bin/logstash -e 'input { stdin { } } output { stdout {} }'
logstash file模块,处理user_agent字段
input{
    file{
        path => ["/var/log/test1.log"]
        codec => "json"
        type => "node1"
        start_position => "beginning"
    }

    file{
        path => ["/var/log/test2.log"]
        codec => "json"
        type => "node2"
        start_position => "beginning"
    }
}


filter{
    if [user_agent] != "-" {                 ## 类似于es的这个模块 ingest-user-agent,不过直接logstash配合es,即使es安装了这个模块user_agent字段也不帮我解析,es这个模块是配合filebeat的
        useragent {
            target => "ua"
            source => "User-Agent"
        }
    }
}

output{
    if [type] == "node1"{
        elasticsearch{
            hosts => ["192.168.x.x:9200"]
            index => "node1-%{+YYYY.MM.dd}"
        }
    }
    if [type] == "node2"{
        elasticsearch{
            hosts => ["192.168.x.x:9200"]
            index => "node2-%{+YYYY.MM.dd}"
        }
    }
}
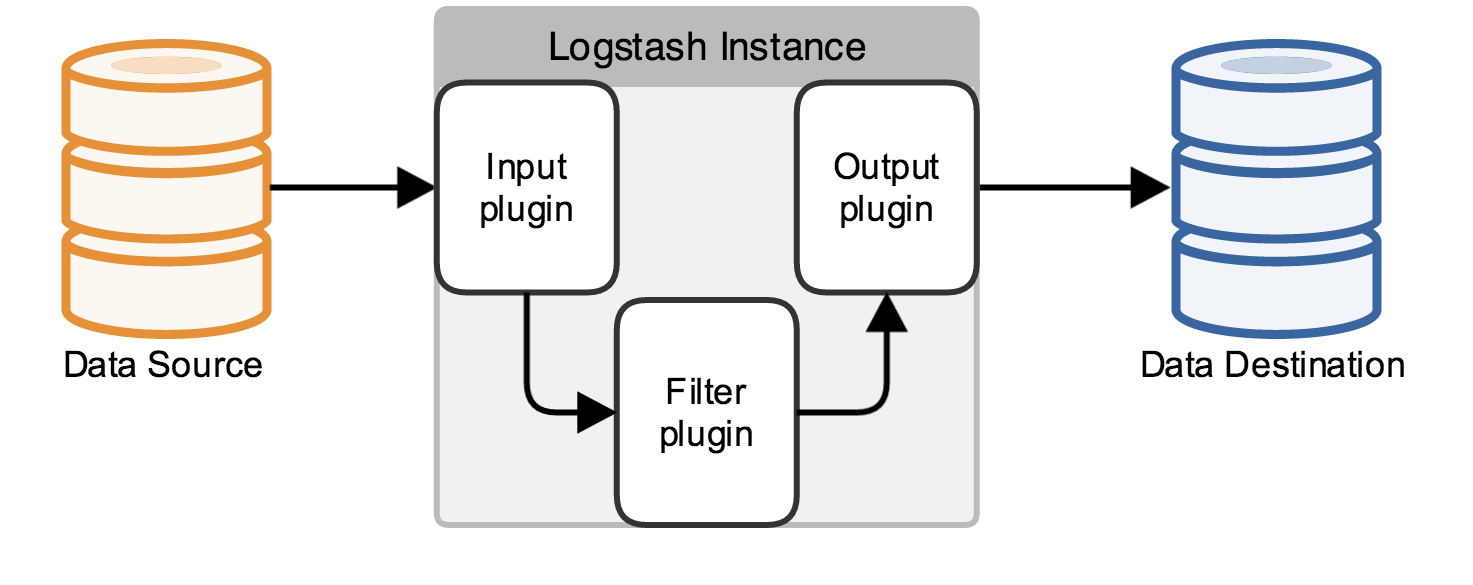
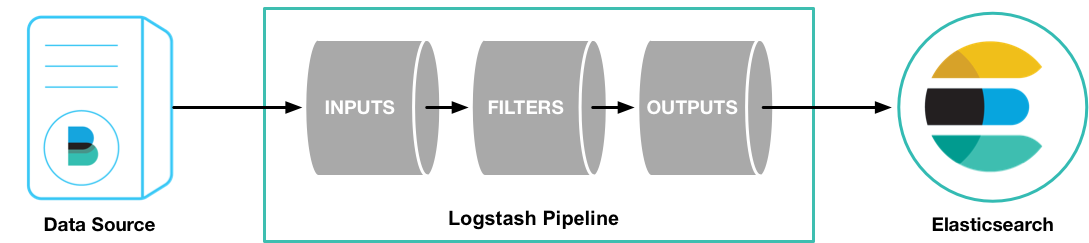
这部分绘图参考见: http://www.cnblogs.com/iiiiher/p/7903262.html
es的两个插件(配合filebeat用)
我使用filebeat nignx模块的时候会用到
bin/elasticsearch-plugin install ingest-user-agent
bin/elasticsearch-plugin install ingest-geoip
搜集syslog+messages+nginx+es日志入库到es
input{
    syslog{
        type => "system-syslog"
        host => "192.168.x.x"
        port => "514"
    }

    file{
        path => ["/var/log/messages"]
        type => "system"
        start_position => "beginning"
    }

    file{
        path => ["/var/log/nginx/access.log"]
        codec => "json"
        type => "nginx-log"
        start_position => "beginning"

    }

    file{
        path => ["/var/log/elasticsearch/es.log"]
        type => "es-error"
        start_position => "beginning"
        codec => multiline{
            pattern => "^["
            negate => true
            what => "previous"
        }
    }
}

output{
    if [type] == "system-syslog"{
        elasticsearch{
            hosts => ["192.168.x.x:9200"]
            index => "system-syslog-%{+YYYY.MM.dd}"
        }
    }
    if [type] == "system"{
        elasticsearch{
            hosts => ["192.168.x.x:9200"]
            index => "system-%{+YYYY.MM.dd}"
        }
    }
    if [type]  == "nginx-log"{
        elasticsearch{
            hosts => ["192.168.x.x:9200"]
            index => "nginx-log-%{+YYYY.MM.dd}"
        }
    }
    if [type]  == "es-error"{
        elasticsearch{
            hosts => ["192.168.x.x:9200"]
            index => "es-error-%{+YYYY.MM.dd}"
        }
    }
}
logstash入库到redis
input {
  stdin{}
}

output{
    redis{
        host => "192.168.x.x"
        port => "6379"
        db => "6"             #会自动在redis里建库
        data_type => "list"
        key => "system-syslog"
    }
}
es从redis读日志
input{
    redis{
        host => "192.168.x.x"
        port => "6379"
        db => "6"
        data_type => "list"
        key => "demo"
    }
}

output{
    elasticsearch{
        hosts => ["192.168.x.x:9200"]
        index => "redis-demo-%{+YYYY.MM.dd}"
    }
}
redis操作
yum install redis -y

$ grep '^[a-z]' /etc/redis.conf
daemonize yes
pidfile /var/run/redis/redis.pid
port 6379
bind 192.168.14.136

/etc/init.d/redis start
redis-cli -h 192.168.x.x
info

INFO
SELECT 6
KEYS *
LINDEX demo -1
LLEN demo

/usr/local/bin/redis-cli -h 127.0.0.1 -p 52833 -a 362bcadfbb0bfa33
logstash接收tcp端口过来的数据
$ cat tcp.conf
input{
    tcp{
        host => "192.168.x.x"
        port => "6666"
    }
}

output{
    stdout{
      codec => "rubydebug"
    }
}


客户端发数据到服务端的6666
yum install nc -y
nc 192.168.x.x 6666 < /etc/resolv.conf
echo "hello jeffery" |nc 192.168.x.x 6666

或者:echo "hello lanny" > /dev/tcp/192.168.x.x/6666

客户端数据:
$ cat /etc/resolv.conf
; generated by /sbin/dhclient-script
search localdomain example.com
nameserver 114.114.114.114


服务器效果
$ ./logstash/bin/logstash -f tcp.conf
Settings: Default pipeline workers: 1
Pipeline main started
{
       "message" => "; generated by /sbin/dhclient-script",
      "@version" => "1",
    "@timestamp" => "2016-10-09T16:08:46.585Z",
          "host" => "192.168.x.x",
          "port" => 35274
}
{
       "message" => "search localdomain example.com",
      "@version" => "1",
    "@timestamp" => "2016-10-09T16:08:46.587Z",
          "host" => "192.168.x.x",
          "port" => 35274
}
{
       "message" => "nameserver 114.114.114.114",
      "@version" => "1",
    "@timestamp" => "2016-10-09T16:08:46.587Z",
          "host" => "192.168.x.x",
          "port" => 35274
}
{
       "message" => "hello jeffery",
      "@version" => "1",
    "@timestamp" => "2016-10-09T16:08:47.467Z",
          "host" => "192.168.x.x",
          "port" => 35275
}
logstash处理syslog日志
客户端:
cat -n /etc/rsyslog.conf
…
79	*.* @@192.168.x.x:514
…


服务端:
$ cat syslog.conf
input{
    syslog{
        type => "system-syslog"
        host => "192.168.x.x"
        port => "514"
    }
}

output{
    stdout{
        codec => "rubydebug"
    }
}
logstash处理nginx日志
    log_format json '{"@timestamp": "$time_iso8601",'
           '"@version": "1",'
           '"client": "$remote_addr",'
		   '"url": "$uri", '
		   '"status": "$status", '
		   '"domain": "$host", '
		   '"host": "$server_addr",'
		   '"size":"$body_bytes_sent", '
		   '"response_time": "$request_time", '
		   '"referer": "$http_referer", '
           '"http_x_forwarded_for": "$http_x_forwarded_for", '
           '"user_agent": "$http_user_agent" } ';
$ cat nginx_access.conf
input{
    file{
        path => ["/app/logs/www1_access.log"]
        codec => "json"
   }
}

output{
    stdout{
        codec => "rubydebug"
    }
}

输入到es
$ cat nginx_access.conf
input{
    file{
        path => ["/app/logs/www1_access.log"]
        codec => "json"
   }
}

output{
    elasticsearch{
            hosts => ["192.168.x.x:9200"]
            index => "nginx-www-access-%{+YYYY.MM.dd}"
        }
}
logstash multiline插件
处理一些不规则的日志
遇到 [ 开头,即截断一条日志

$ cat multiline.conf
input{
    stdin{
        codec => multiline{
            pattern => "^["
            negate => true
            what => "previous"
        }
    }
}

output{
    stdout{
        codec => "rubydebug"
    }
}
举个例子
kjhjk
jkjk
[fasdfasd
[

这是一条
kjhjk
jkjk

这是另一条
fasdfasd