###当然,这里说的数据库软件是percona,不是公版的mysql。
MySQL慢日志想必大家或多或少都有听说,主要是用来记录MySQL中长时间执行(超过long_query_time 单位秒),同时examine的行数超过min_examined_row_limit ,影响MySQL性能的SQL语句,以便DBA进行优化。
在MySQL中,如果一个SQL需要长时间等待获取一把锁,那么这段获取锁的时间并不算执行时间,当SQL执行完成,释放相应的锁,才会记录到慢日志中,所以MySQL的慢日志中记录的顺序和实际的执行顺序可能不大一样。
在默认情况下,MySQL的慢日志记录是关闭的,我们可以通过将设置slow_query_log=1来打开MySQL的慢查询日志,通过slow_query_log_file=file_name来设置慢查询的文件名,如果文件名没有设置,
他的默认名字为 host_name-slow.log。同时,我们也可以设置 log-output={FILE|TABLE}来指定慢日志是写到文件还是数据库里面(如果设置log-output=NONE,将不进行慢日志记录,即使slow_query_log=1)。
MySQL的管理维护命令的慢SQL并不会被记录到MySQL慢日志中。常见的管理维护命令包括ALTER TABLE,ANALYZE TABLE, CHECK TABLE, CREATE INDEX, DROP INDEX, OPTIMIZE TABLE, 和REPAIR TABLE。
如果希望MySQL的慢日志记录这类长时间执行的命令,可以设置log_slow_admin_statements 为1。
通过设置log_queries_not_using_indexes=1,MySQL的慢日志也能记录那些不使用索引的SQL(并不需要超过long_query_time,两者条件满足一个即可)。
但打开该选项的时候,如果你的数据库中存在大量没有使用索引的SQL,那么MySQL慢日志的记录量将非常大,
所以通常还需要设置参数log_throttle_queries_not_using_indexes 。默认情况下,该参数为0,表示不限制,当设置改参数为大于0的值的时候,表示MySQL在一分钟内记录的不使用索引的SQL的数量,来避免慢日志记录过多的该类SQL.
在MySQL 5.7.2 之后,如果设置了慢日志是写到文件里,需要设置log_timestamps 来控制写入到慢日志文件里面的时区(该参数同时影响general日志和err日志)。如果设置慢日志是写入到数据库中,该参数将不产生作用。
所以,总结下哪些SQL能被MySQL慢日志记录:
- 不会记录MySQL中的管理维护命令,除非明确设置log_slow_admin_statements=1;
- SQL执行时间必须超过long_query_time,(不包括锁等待时间)
- 参数log_queries_not_using_indexes设置为1,且SQL没有用到索引,同时没有超过log_throttle_queries_not_using_indexes 参数的设定。
- 查询examine的行数必须超过min_examined_row_limit
注:如果表没有记录或者只有1条记录,优化器觉得走索引并不能提升效率,即使设置了log_queries_not_using_indexes=1,那么也不会记录到慢日志中。
注:如果SQL使用了QC,那也不会记录到慢日志中。
注:修改密码之类的维护操作,密码部分将会被星号代替,避免明文显示。
Anemometer 简介:
项目地址:https://github.com/box/Anemometer
演示地址:http://lab.fordba.com/anemometer/
Anemometer 是一个图形化显示从MySQL慢日志的工具。结合pt-query-digest,Anemometer可以很轻松的帮你去分析慢查询日志,让你很容易就能找到哪些SQL需要优化。
如果你想要使用Anemometer这个工具,那么你需要准备以下环境:
- 一个用来存储分析数据的MySQL数据库
- pt-query-digest. (doc: Percona Toolkit )
- MySQL数据库的慢查询日志 (doc: The Slow Query Log )
- PHP版本为 5.5+ apache或者nginx等web服务器均可。
安装:
- 下载Anemometer
git clone git://github.com/box/Anemometer.git anemometer
载入数据:
首先创建表结构,将global_query_review 以及global_query_review_history 创建出来。由于表定义中存在0000-00-00 00:00:00 的日期默认值,需要修改sql_mode,将其zero_date的sql_mode 关闭,同时关闭only_full_group_by
cd /www/lab/anemometer
mysql < ./install.sql
现在需要使用pt-query-digest 抓取MySQL的慢查询日志,然后将数据插入到slow_query_log 数据库的相应表中
使用如下方式载入数据,h表示主机名或者ip地址,D表示database,t表示表名,再最后面跟上慢日志路径。
如果 pt-query-digest version > 2.2:
$ pt-query-digest --user=anemometer --password=superSecurePass
                  --review h=127.0.0.1,D=slow_query_log,t=global_query_review
                  --review-history h=127.0.0.1,D=slow_query_log,t=global_query_review_history
                  --no-report --limit=0%
                  --filter=" $event->{Bytes} = length($event->{arg}) and $event->{hostname}="$HOSTNAME""
                  /data/mysql/slow-query.log
如果 pt-query-digest version <= 2.2
$  pt-query-digest --user=root --password=root  --review h=127.0.0.1,D=slow_query_log,t=global_query_review
--history h=127.0.0.1,D=slow_query_log,t=global_query_review_history  --no-report --limit=0%
--filter=" $event->{Bytes} = length($event->{arg}) and $event->{hostname}="$HOSTNAME""  /data/mysql/slow-query.log


Pipeline process 11 (aggregate fingerprint) caused an error: Argument "57A" isn't numeric in numeric gt (>) at (eval 40) line 6, <> line 27.
Pipeline process 11 (aggregate fingerprint) caused an error: Argument "57B" isn't numeric in numeric gt (>) at (eval 40) line 6, <> line 28.
Pipeline process 11 (aggregate fingerprint) caused an error: Argument "57C" isn't numeric in numeric gt (>) at (eval 40) line 6, <> line 29.
如果你看到一些报错如上面例子所示,脚本并没有出现问题,他只是输出当前的操作。
配置Anemometer
修改Anemometer配置文件
$ cd anemometer/conf
$ cp sample.config.inc.php config.inc.php
示例的配置文件中,你需要进行部分修改,用来连接数据库获取慢查询的分析数据。
修改 datasource_localhost.inc.php 文件中的配置,主要为主机
$conf['datasources']['localhost'] = array(
    'host'  => '127.0.0.1',
    'port'  => 3306,
    'db'    => 'slow_query_log',
    'user'  => 'root',
    'password' => 'root',
    'tables' => array(
        'global_query_review' => 'fact',
        'global_query_review_history' => 'dimension'
    ),
        'source_type' => 'slow_query_log'
);
然后访问127.0.0.1/anemometer 的时候出现
Expression #2 of SELECT list is not in GROUP BY clause and contains nonaggregated column
'slow_query_log.dimension.sample' which is not functionally dependent on columns in GROUP BY clause; this is incompatible with sql_mode=only_full_group_by (1055)
需要将sql_mode 中only_full_group_by 关闭。
如果你想利用Anemometer 的explain功能来获取执行计划,修改配置文件的以下部分。
$conf['plugins'] = array(
     'visual_explain' => '/usr/local/bin/pt-visual-explain',  --这里需要修改为正确的路径
        ...
    'explain'       =>      function ($sample) {
        $conn['user'] = 'anemometer';
        $conn['password'] = 'superSecurePass';

        return $conn;
    },
);
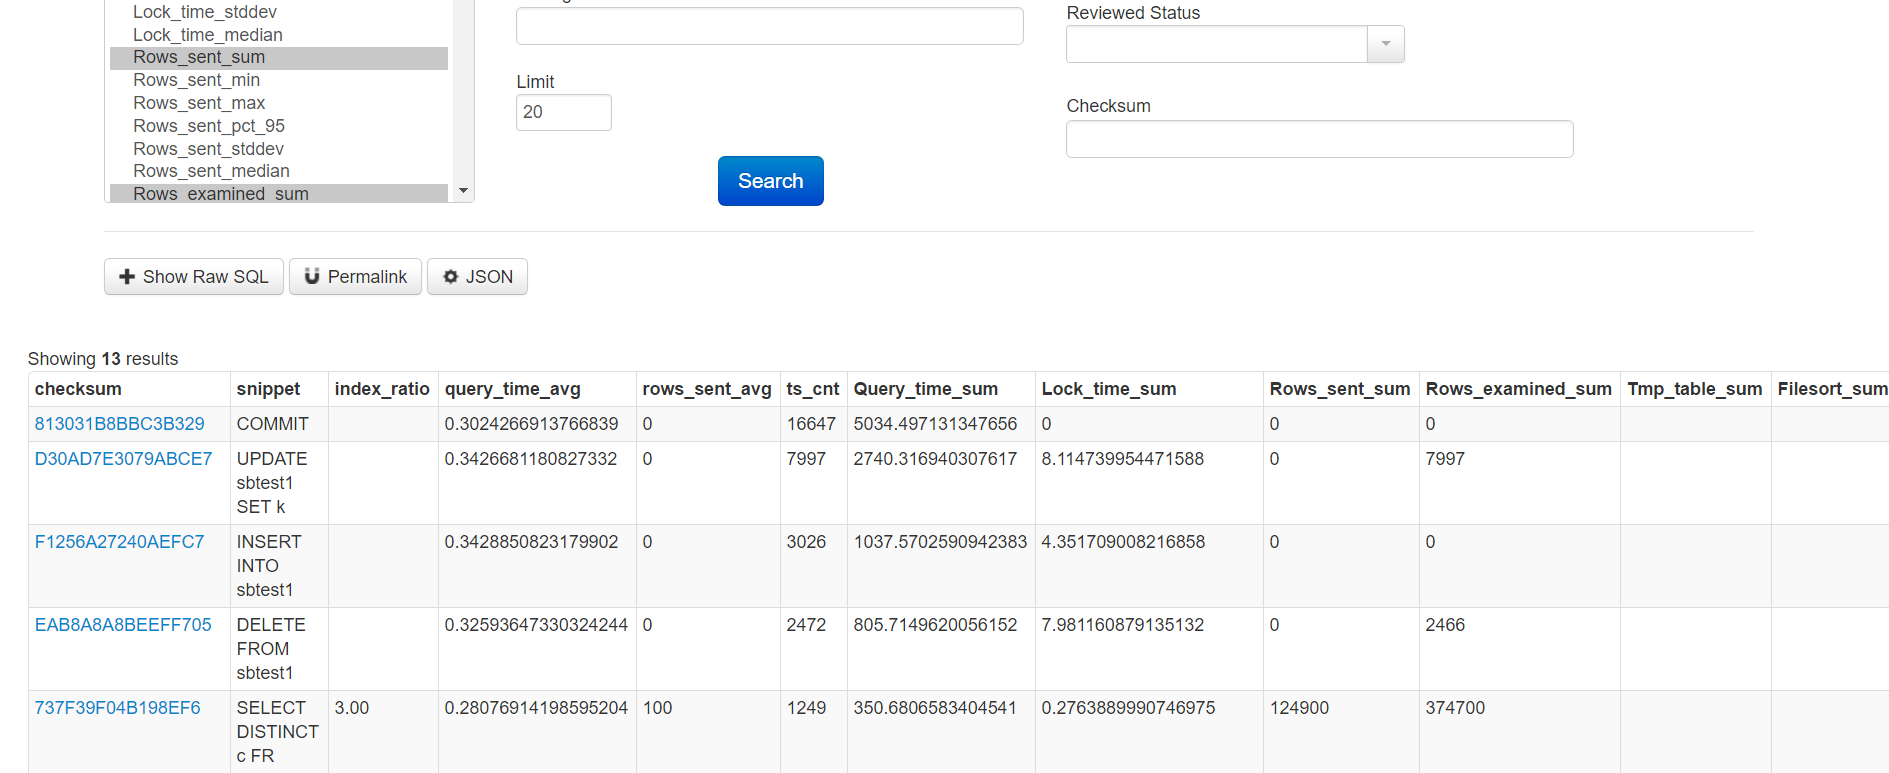
结果展示:
在5.7中,默认SQL_MODE是启用ONLY_FULL_GROUP_BY的,需要将其关闭,否则Anemometer将报错。
选择相应的列,然后点击search,就可以显示结果
sql执行计划查看以及历史
当我们选择一个sql的hash值的时候,能看到他的一个具体的执行计划,同时也能看到匹配该sql的历史sql,消耗,表的统计信息,建表语句等。
同时也能针对sql进行评论,为sql优化提交建议等。
创建自动收集慢日志脚本
在anemometer下面的script文件中有个收集脚本,可以通过crontab进行定时收集慢日志,语法如下:
Usage: ./scripts/anemometer_collect.sh --interval

Options:
    --socket -S              The mysql socket to use
    --defaults-file          The defaults file to use for the client
    --interval -i            The collection duration
    --rate                   Set log_slow_rate_limit (For Percona MySQL Only)

    --history-db-host        Hostname of anemometer database server
    --history-db-port        Port of anemometer database server
    --history-db-name        Database name of anemometer database server (Default slow_query_log)
    --history-defaults-file  Defaults file to pass to pt-query-digest for connecting to the remote anemometer database
示例脚本:
cd anemometer
mkdir etc
cd etc
vi anemometer.local.cnf   --这里创建配置文件,添加用户名密码
[client]
user=anemometer_local
password=superSecurePass
./scripts/anemometer_collect.sh --interval 30 --history-db-host=127.0.0.1
# Time: 2020-03-13T21:02:40.710834+08:00
# User@Host: ashes2_x[ashes2_x] @  [10.10.10.10]  Id: 93181
# Schema:   Last_errno: 0  Killed: 0
# Query_time: 4.698308  Lock_time: 0.000288  Rows_sent: 10000  Rows_examined: 900000  Rows_affected: 0
# Bytes_sent: 894213  Tmp_tables: 1  Tmp_disk_tables: 1  Tmp_table_sizes: 16384
# InnoDB_trx_id: 0
# QC_Hit: No  Full_scan: Yes  Full_join: No  Tmp_table: Yes  Tmp_table_on_disk: Yes
# Filesort: No  Filesort_on_disk: No  Merge_passes: 0
#   InnoDB_IO_r_ops: 0  InnoDB_IO_r_bytes: 0  InnoDB_IO_r_wait: 0.000000
#   InnoDB_rec_lock_wait: 0.000000  InnoDB_queue_wait: 0.000000
#   InnoDB_pages_distinct: 8102
SET timestamp=1584104560;
SELECT * FROM (select id,title,keywords,category_id,create_time from tv_ashes.short_movie where publish_status=10  limit 880000,10000) t;
# Time: 2020-03-13T21:02:40.724336+08:00
# User@Host: ashes2_x[ashes2_x] @  [10.10.10.11]  Id: 93185
# Schema:   Last_errno: 0  Killed: 0
# Query_time: 4.711351  Lock_time: 0.000204  Rows_sent: 10000  Rows_examined: 910000  Rows_affected: 0
# Bytes_sent: 920165  Tmp_tables: 1  Tmp_disk_tables: 1  Tmp_table_sizes: 16384
# InnoDB_trx_id: 0
# QC_Hit: No  Full_scan: Yes  Full_join: No  Tmp_table: Yes  Tmp_table_on_disk: Yes
# Filesort: No  Filesort_on_disk: No  Merge_passes: 0
#   InnoDB_IO_r_ops: 175  InnoDB_IO_r_bytes: 2867200  InnoDB_IO_r_wait: 0.025178
#   InnoDB_rec_lock_wait: 0.000000  InnoDB_queue_wait: 0.000000
#   InnoDB_pages_distinct: 8107
SET timestamp=1584104560;
SELECT * FROM (select id,title,keywords,category_id,create_time from tv_ashes.short_movie where publish_status=10  limit 890000,10000) t;
# Time: 2020-03-13T21:02:41.572673+08:00
# User@Host: ashes2_x[ashes2_x] @  [10.10.10.10]  Id: 93163
# Schema:   Last_errno: 0  Killed: 0
# Query_time: 3.642372  Lock_time: 0.000196  Rows_sent: 10000  Rows_examined: 920000  Rows_affected: 0
# Bytes_sent: 897788  Tmp_tables: 1  Tmp_disk_tables: 1  Tmp_table_sizes: 16384
# InnoDB_trx_id: 0
# QC_Hit: No  Full_scan: Yes  Full_join: No  Tmp_table: Yes  Tmp_table_on_disk: Yes
# Filesort: No  Filesort_on_disk: No  Merge_passes: 0
#   InnoDB_IO_r_ops: 5  InnoDB_IO_r_bytes: 81920  InnoDB_IO_r_wait: 0.001347
#   InnoDB_rec_lock_wait: 0.000000  InnoDB_queue_wait: 0.000000
#   InnoDB_pages_distinct: 8107
SET timestamp=1584104561;
SELECT * FROM (select id,title,keywords,category_id,create_time from tv_ashes.short_movie where publish_status=10  limit 900000,10000) t;
##########################################################################################################################################
# Time: 2020-03-13T21:02:41.572673+08:00
# User@Host: ashes2_x[ashes2_x] @  [10.10.10.10]  Id: 93163
# Schema:   Last_errno: 0  Killed: 0
# Query_time: 3.642372  Lock_time: 0.000196  Rows_sent: 10000  Rows_examined: 920000  Rows_affected: 0
# Bytes_sent: 897788  Tmp_tables: 1  Tmp_disk_tables: 1  Tmp_table_sizes: 16384
# InnoDB_trx_id: 0
# QC_Hit: No  Full_scan: Yes  Full_join: No  Tmp_table: Yes  Tmp_table_on_disk: Yes
# Filesort: No  Filesort_on_disk: No  Merge_passes: 0
#   InnoDB_IO_r_ops: 5  InnoDB_IO_r_bytes: 81920  InnoDB_IO_r_wait: 0.001347
#   InnoDB_rec_lock_wait: 0.000000  InnoDB_queue_wait: 0.000000
#   InnoDB_pages_distinct: 8107
SET timestamp=1584104561;
SELECT * FROM (select id,title,keywords,category_id,create_time from tv_ashes.short_movie where publish_status=10  limit 900000,10000) t;
###########################################################################################################################################
一般而言,慢查询日志都是这样固定的组成:
一共13行:
第1行:记录时间。
     表示的是该慢查询被记录的时间,
第2行:用户信息与线程id。
      表示的是执行查询的用户,用户是由用户名称和用户的ip构成。线程id表示哪个线程执行的。
第3行:模式信息
第4行:时间和行数。
      表示的是执行语句的执行时间、锁等待时间(在服务器阶段的锁等待而不是存储引擎阶段的锁等待)、返回行数、扫描行数、更改的行数(增删改操作引起的)
第5行:数据量,表信息
第6行:事务id
第7行:缓存命中、全表扫描、联合查询无索引、临时表、基于磁盘的临时表。
      表示该慢查询sql是否从查询缓存中获得值、是否进行了全表扫描、是否进行了没有索引的联合查询、是否使用了临时表、是否使用了在磁盘上的临时表。
第8行:文件排序。
      表示是否使用了文件排序、如果使用了文件派逊则是否在磁盘上进行了文件排序、如果有文件排序则进行了多少次排序合并。
第9行:如果使用了innodb的话就有这一行。
      表示的是在查询期间,innodb安排了多少次页面读取操作、
第10行:
第11行:
第12行:时间戳
第13行:慢查询语句
# Time: 2020-03-09T23:01:26.116987+08:00
# User@Host: skip-grants user[igoodful] @  [127.0.0.1]  Id:     3
# Schema: tv_error  Last_errno: 1880  Killed: 0
# Query_time: 15.720529  Lock_time: 0.001370  Rows_sent: 0  Rows_examined: 0  Rows_affected: 393806
# Bytes_sent: 58  Tmp_tables: 0  Tmp_disk_tables: 0  Tmp_table_sizes: 0
# InnoDB_trx_id: 0
# QC_Hit: No  Full_scan: No  Full_join: No  Tmp_table: No  Tmp_table_on_disk: No
# Filesort: No  Filesort_on_disk: No  Merge_passes: 0
#   InnoDB_IO_r_ops: 228  InnoDB_IO_r_bytes: 3735552  InnoDB_IO_r_wait: 0.040748
#   InnoDB_rec_lock_wait: 0.000000  InnoDB_queue_wait: 0.000000
#   InnoDB_pages_distinct: 6515
use tv_igoodful;
SET timestamp=1583766086;
ALTER TABLE `mydb`.`video_old` FORCE;
# Time: 2020-03-09T23:01:27.371086+08:00
# User@Host: skip-grants user[igoodful] @  [127.0.0.1]  Id:     3
# Schema: tv_error  Last_errno: 1880  Killed: 0
# Query_time: 1.253988  Lock_time: 0.001060  Rows_sent: 0  Rows_examined: 0  Rows_affected: 32369
# Bytes_sent: 56  Tmp_tables: 0  Tmp_disk_tables: 0  Tmp_table_sizes: 0
# InnoDB_trx_id: 0
# QC_Hit: No  Full_scan: No  Full_join: No  Tmp_table: No  Tmp_table_on_disk: No
# Filesort: No  Filesort_on_disk: No  Merge_passes: 0
#   InnoDB_IO_r_ops: 217  InnoDB_IO_r_bytes: 3555328  InnoDB_IO_r_wait: 0.020998
#   InnoDB_rec_lock_wait: 0.000000  InnoDB_queue_wait: 0.000000
#   InnoDB_pages_distinct: 1024
SET timestamp=1583766087;
ALTER TABLE `mydb`.`video_old` FORCE;
create table slow_log (id bigint not null auto_increment,
user varchar(64) not null default '',
host varchar(32) not null default '',
db varchar(255) not null default '',
sql_statement varchar(6000) not null default '',
thread_id bigint not null default -1,
innodb_trx_id varchar(64) not null default '',
record_time varchar(32) not null default '',
query_time double not null default -1,
lock_time  double not null default -1,
innodb_rec_lock_wait double not null default -1,
innodb_queue_wait double not null default -1,
rows_sent int not null default -1,
rows_examined int not null default -1,
rows_affected int not null default -1,
bytes_sent int not null default -1,
last_errno int not null default -1,
killed int not null default -1,
tmp_tables int not null default -1,
tmp_disk_tables int not null default -1,
tmp_table_sizes int not null default -1,
qc_hit varchar(16) not null default '',
full_scan varchar(16) not null default '',
full_join varchar(16) not null default '',
tmp_table varchar(16) not null default '',
tmp_table_on_disk varchar(16) not null default '',
filesort varchar(16) not null default '',
filesort_on_disk varchar(16) not null default '',
merge_passes int not null default -1,
innodb_io_r_ops int not null default -1,
innodb_io_r_bytes int not null default -1,
innodb_io_r_wait double not null default -1,
innodb_pages_distinct int not null default -1,
record_timestamp varchar(64) not null default '',
state varchar(32) not null default '',
primary key(id),
index idx_sql_statement(sql_statement(64)),
index idx_rows_sent(rows_sent),
index idx_rows_examined(rows_examined),
index idx_rows_affected(rows_affected),
index idx_bytes_sent(bytes_sent),
index idx_record_time(record_time),
index idx_query_time(query_time),
index idx_lock_time(lock_time),
index idx_innodb_rec_lock_wait(innodb_rec_lock_wait),
index idx_innodb_queue_wait(innodb_queue_wait),
index idx_thread_id(thread_id),
index idx_innodb_trx_id(innodb_trx_id)
) ENGINE=InnoDB DEFAULT CHARSET=utf8mb4;