1、设计思路
(1)运用导航条,实现多个图在同一界面;
(2)实现各种不同的图
2、设计源码
chart.mxml:
<?xml version="1.0" encoding="utf-8"?>
<s:Application xmlns:fx="http://ns.adobe.com/mxml/2009"
			   xmlns:s="library://ns.adobe.com/flex/spark"
			   xmlns:mx="library://ns.adobe.com/flex/mx"
			   width="100%" height="100%"
			   xmlns:charts="mx.charts.*"
			   xmlns:series="mx.charts.series.*">
	<s:layout>
		<s:BasicLayout/>
	</s:layout>
	<fx:Declarations>

	</fx:Declarations>

	<fx:Script>
		<![CDATA[
			import mx.collections.ArrayCollection;

			[Bindable]
			private var chartArray:ArrayCollection = new ArrayCollection([
				{total:"星期一",apple:"78454",banana:"89454",orange:"45122",peach:"65323"},
				{total:"星期二",apple:"57854",banana:"65454",orange:"56122",peach:"78845"},
				{total:"星期三",apple:"56454",banana:"51544",orange:"45121",peach:"95656"},
				{total:"星期四",apple:"95659",banana:"65645",orange:"32323",peach:"42122"},
				{total:"星期五",apple:"54555",banana:"56566",orange:"56232",peach:"56512"},
				{total:"星期六",apple:"54452",banana:"12454",orange:"78454",peach:"26565"},
				{total:"星期日",apple:"23346",banana:"56129",orange:"56444",peach:"23566"},
			]);

			[Bindable]
			private var candArray:ArrayCollection = new ArrayCollection([
				{ Date: "2013-01-01", Open: 40.75,  High: 40.75, Low: 40.24, Close:40.31},
				{ Date: "2013-01-02", Open: 39.98,  High: 40.78, Low: 39.97, Close:40.34},
				{ Date: "2013-01-03", Open: 40.38,  High: 40.66, Low: 40.12, Close:40.63},
				{ Date: "2013-01-04", Open: 40.49,  High: 40.99, Low: 40.32, Close:40.98},
				{ Date: "2013-01-05", Open: 40.13,  High: 40.46, Low: 39.65, Close:39.95},
				{ Date: "2013-01-06", Open: 39.00,  High: 39.50, Low: 38.78, Close:38.62},
				{ Date: "2013-01-07", Open: 38.68,  High: 39.34, Low: 37.75, Close:38.84},
				{ Date: "2013-01-08", Open: 38.76,  High: 38.76, Low: 38.03, Close:38.12},
				{ Date: "2013-01-09", Open: 37.98,  High: 37.98, Low: 36.56, Close:36.69},
				{ Date: "2013-01-10", Open: 36.61,  High: 37.56, Low: 36.48, Close:36.86}
			]);
 		]]>
	</fx:Script>

	<mx:TabNavigator width="100%" height="100%" paddingBottom="10" paddingLeft="10" paddingRight="10" paddingTop="10">
		<s:NavigatorContent label="饼图" width="100%" height="100%">
			<mx:VBox width="100%" height="100%">
				<charts:PieChart id="pie" dataProvider="{chartArray}" height="90%" width="100%" showDataTips="true">
					<charts:series>
						<series:PieSeries displayName="总收入" field="apple" nameField="total"/>
					</charts:series>
				</charts:PieChart>
				<mx:HBox width="100%">
					<s:Label width="30%"/>
					<charts:Legend dataProvider="{pie}" direction="horizontal"/>
				</mx:HBox>

			</mx:VBox>
		</s:NavigatorContent>
		<s:NavigatorContent label="柱状图" width="100%" height="100%">
			<mx:VBox width="100%" height="100%">
				<charts:ColumnChart  id="column" dataProvider="{chartArray}" showDataTips="true" width="100%" height="90%" fontSize="16">
					<charts:horizontalAxis>
						<charts:CategoryAxis categoryField="total" displayName="星期"/>
					</charts:horizontalAxis>
					<charts:series>
						<series:ColumnSeries displayName="苹果" yField="apple" xField="total"/>
						<series:ColumnSeries displayName="香蕉" yField="banana" xField="total"/>
						<series:ColumnSeries displayName="橘子" yField="orange" xField="total"/>
						<series:ColumnSeries displayName="桃子" yField="peach" xField="total"/>
					</charts:series>
				</charts:ColumnChart>
				<mx:HBox width="100%">
					<s:Label width="45%"/>
					<charts:Legend dataProvider="{column}" height="25" fontSize="16"/>
				</mx:HBox>
			</mx:VBox>
		</s:NavigatorContent>
		<s:NavigatorContent label="面积图" width="100%" height="100%">
			<mx:VBox width="100%" height="100%">
				<charts:AreaChart id="area" dataProvider="{chartArray}" fontSize="16" width="100%" height="90%" showDataTips="true">
					<charts:horizontalAxis>
						<charts:CategoryAxis categoryField="total" displayName="星期"/>
					</charts:horizontalAxis>
					<charts:series>
						<series:AreaSeries displayName="苹果" yField="apple" xField="total"/>
						<series:AreaSeries displayName="香蕉" yField="banana" xField="total"/>
						<series:AreaSeries displayName="橘子" yField="orange" xField="total"/>
						<series:AreaSeries displayName="桃子" yField="peach" xField="total"/>
					</charts:series>
				</charts:AreaChart>
				<mx:HBox width="100%">
					<s:Label width="45%"/>
					<charts:Legend dataProvider="{area}" height="25" fontSize="16"/>
				</mx:HBox>
			</mx:VBox>
		</s:NavigatorContent>
		<s:NavigatorContent label="折线图" width="100%" height="100%">
			<mx:VBox width="100%" height="100%">
				<charts:LineChart id="line" dataProvider="{chartArray}" fontSize="16" width="100%" height="90%" showDataTips="true">
					<charts:horizontalAxis>
						<charts:CategoryAxis categoryField="total" displayName="星期"/>
					</charts:horizontalAxis>
					<charts:series>
						<series:LineSeries displayName="苹果" yField="apple" xField="total"/>
						<series:LineSeries displayName="香蕉" yField="banana" xField="total"/>
						<series:LineSeries displayName="橘子" yField="orange" xField="total"/>
						<series:LineSeries displayName="桃子" yField="peach" xField="total"/>
					</charts:series>
				</charts:LineChart>
				<mx:HBox width="100%">
					<s:Label width="45%"/>
					<charts:Legend dataProvider="{line}" height="25" fontSize="16"/>
				</mx:HBox>
			</mx:VBox>
		</s:NavigatorContent>
		<s:NavigatorContent label="条状图" width="100%" height="100%">
			<mx:VBox width="100%" height="100%">
				<charts:BarChart id="bar" dataProvider="{chartArray}" fontSize="16" width="100%" height="90%" showDataTips="true">
					<charts:verticalAxis>
						<charts:CategoryAxis categoryField="total" displayName="星期"/>
					</charts:verticalAxis>
					<charts:series>
						<series:BarSeries displayName="苹果" xField="apple" yField="total"/>
						<series:BarSeries displayName="香蕉" xField="banana" yField="total"/>
						<series:BarSeries displayName="橘子" xField="orange" yField="total"/>
						<series:BarSeries displayName="桃子" xField="peach" yField="total"/>
					</charts:series>
				</charts:BarChart>
				<mx:HBox width="100%">
					<s:Label width="45%"/>
					<charts:Legend dataProvider="{bar}" height="25" fontSize="16"/>
				</mx:HBox>
			</mx:VBox>
		</s:NavigatorContent>
		<s:NavigatorContent label="气泡图" width="100%" height="100%">
			<mx:VBox width="100%" height="100%">
				<charts:BubbleChart id="bubble" dataProvider="{chartArray}" fontSize="16" showDataTips="true" width="100%" height="90%">
					<charts:series>
						<series:BubbleSeries displayName="苹果" yField="apple" radiusField="banana"/>
						<series:BubbleSeries displayName="橘子" yField="orange" radiusField="banana"/>
						<series:BubbleSeries displayName="桃子" yField="peach" radiusField="banana"/>
					</charts:series>
				</charts:BubbleChart>
				<mx:HBox width="100%">
					<s:Label width="45%"/>
					<charts:Legend dataProvider="{bubble}" height="25"/>
				</mx:HBox>
			</mx:VBox>
		</s:NavigatorContent>
		<s:NavigatorContent label="蜡烛图" width="100%" height="100%">
			<mx:VBox width="100%" height="100%">
				<charts:CandlestickChart id="candlestick" dataProvider="{candArray}" fontSize="16" width="100%" height="90%">
					<charts:verticalAxis>
						<mx:LinearAxis id="haxis" baseAtZero="true" title="Price"/>
					</charts:verticalAxis>
					<charts:horizontalAxis>
						<mx:CategoryAxis categoryField="Date" title="Date" displayName="日期"/>
					</charts:horizontalAxis>
					<charts:horizontalAxisRenderers>
						<mx:AxisRenderer axis="{haxis}" canDropLabels="true"/>
					</charts:horizontalAxisRenderers>
					<charts:series>
						<series:CandlestickSeries  openField="Open"
												   highField="High"
												   lowField="Low"
												   closeField="Close"/>
					</charts:series>
				</charts:CandlestickChart>
				<mx:HBox width="100%">
					<s:Label width="45%"/>
					<charts:Legend dataProvider="{candlestick}" height="25"/>
				</mx:HBox>
			</mx:VBox>
		</s:NavigatorContent>
		<s:NavigatorContent label="基址图" width="100%" height="100%">
			<mx:VBox width="100%" height="100%">
				<mx:PlotChart id="plot" dataProvider="{chartArray}" fontSize="16" showDataTips="true" width="100%" height="90%">
					<mx:horizontalAxis>
						<mx:CategoryAxis categoryField="total" displayName="星期"/>
					</mx:horizontalAxis>
					<mx:series>
						<mx:PlotSeries displayName="苹果" yField="apple" xField="total"/>
						<mx:PlotSeries displayName="香蕉" yField="banana" xField="total"/>
						<mx:PlotSeries displayName="橘子" yField="orange" xField="total"/>
						<mx:PlotSeries displayName="桃子" yField="peach" xField="total"/>
					</mx:series>
				</mx:PlotChart>
				<mx:HBox width="100%">
					<s:Label width="45%"/>
					<charts:Legend dataProvider="{plot}" height="25"/>
				</mx:HBox>
			</mx:VBox>
		</s:NavigatorContent>
	</mx:TabNavigator>
</s:Application>
3、运行结果
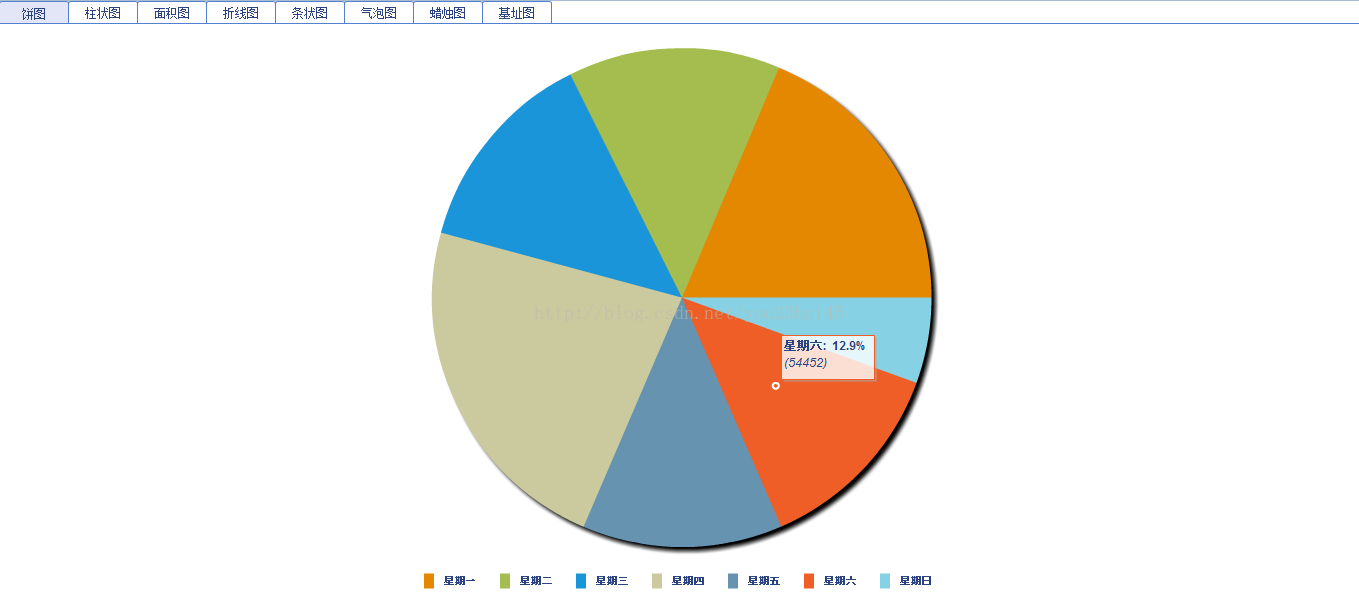
(1)饼图
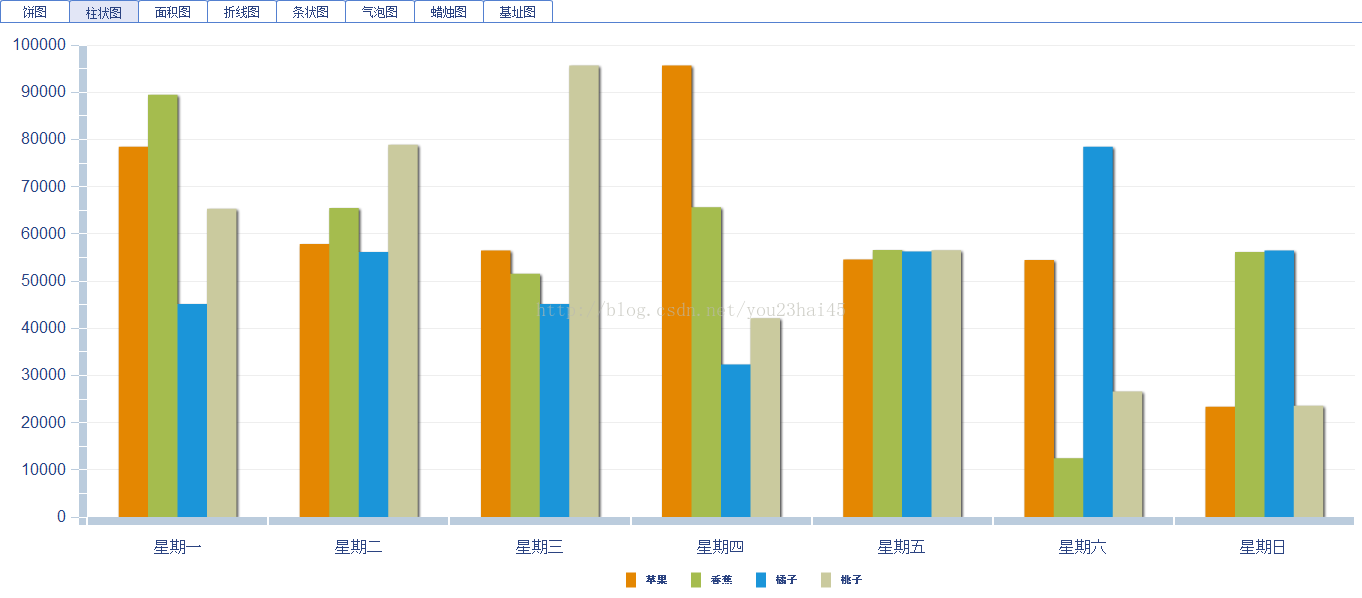
(2)柱状图
(3)面积图

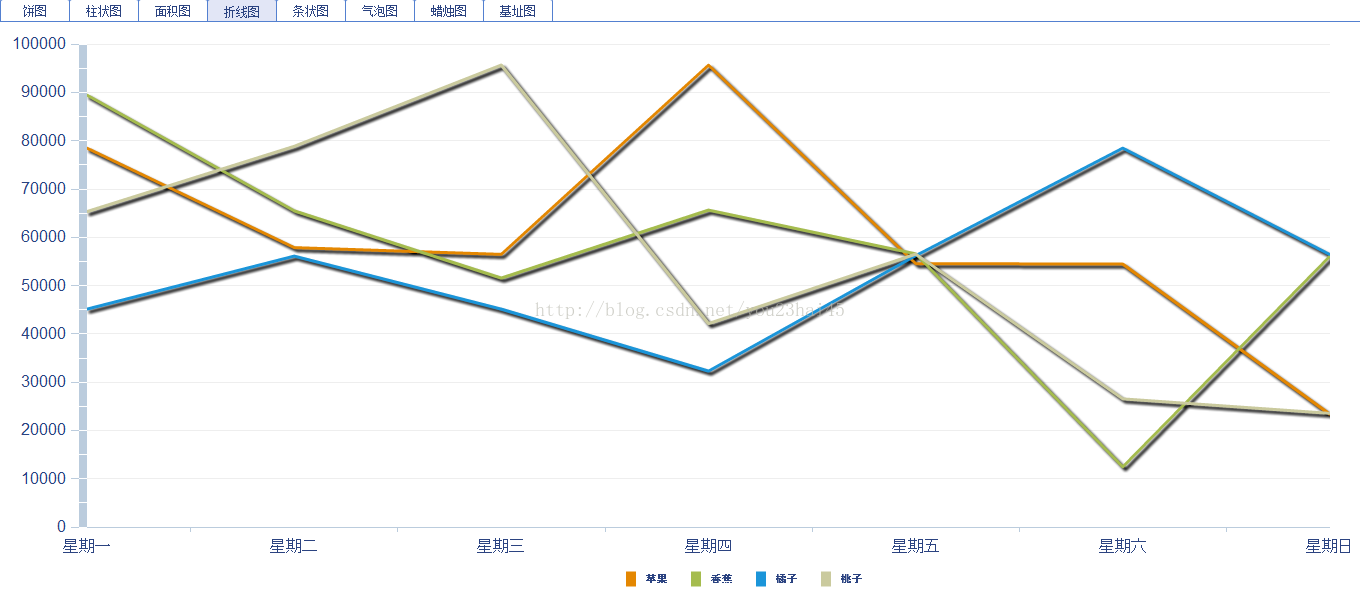
(4)折线图
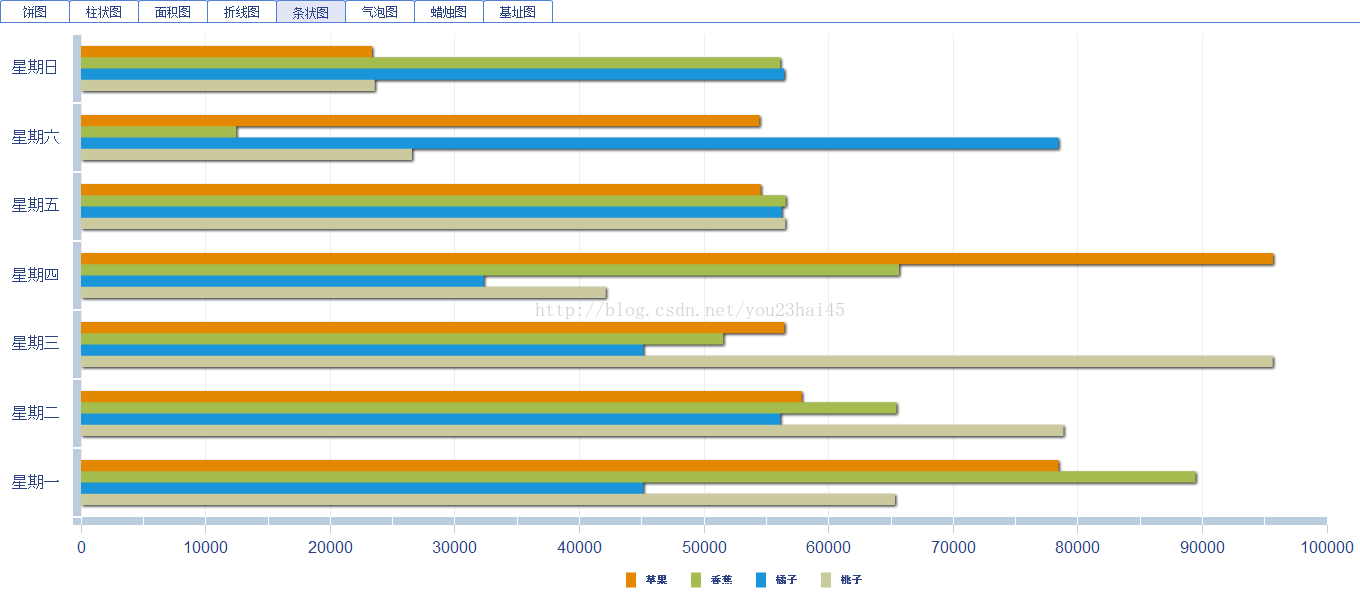
(5)条状图
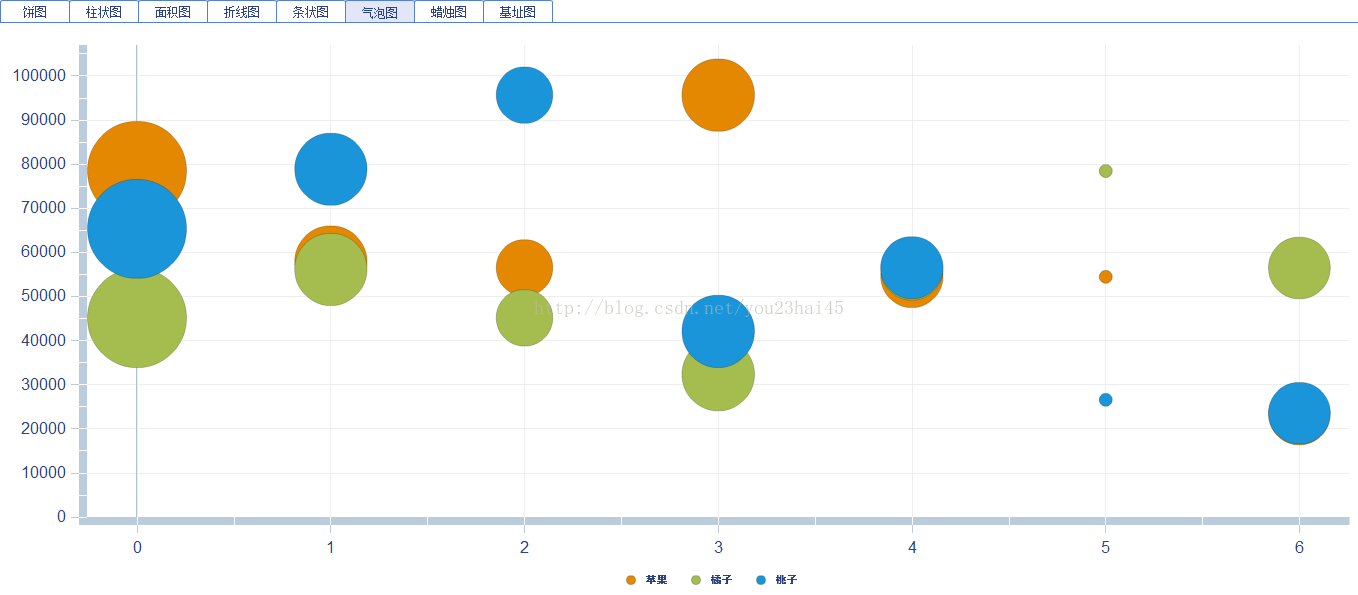
(6)气泡图
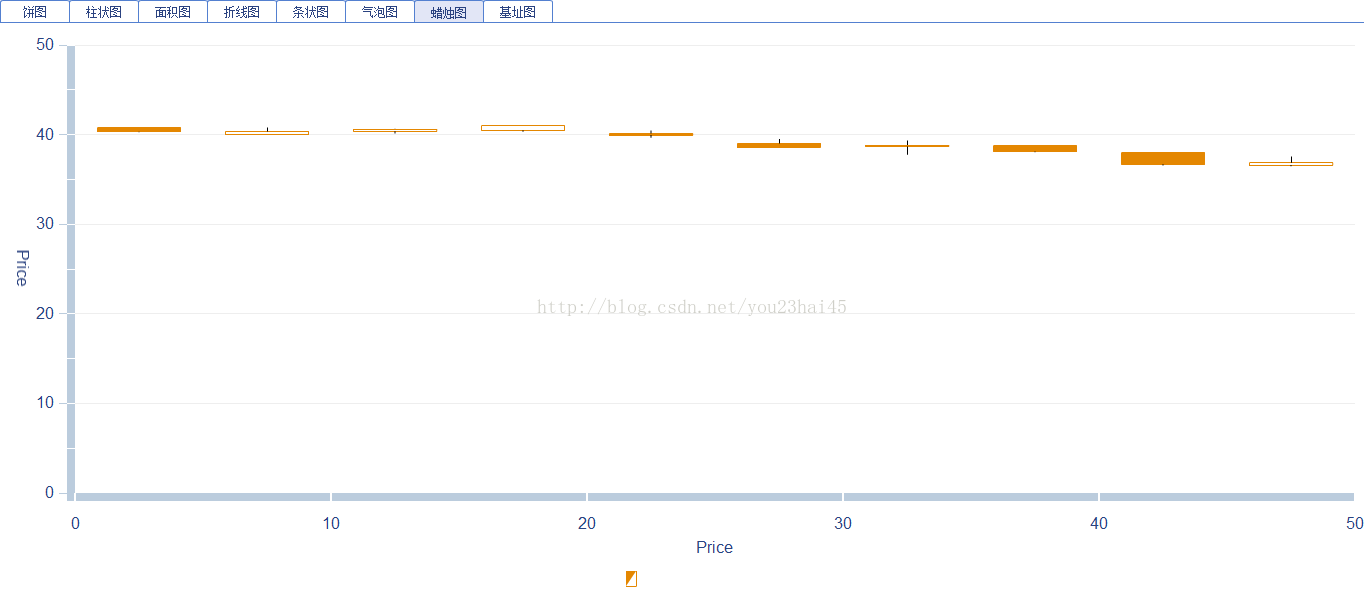
(7)蜡烛图
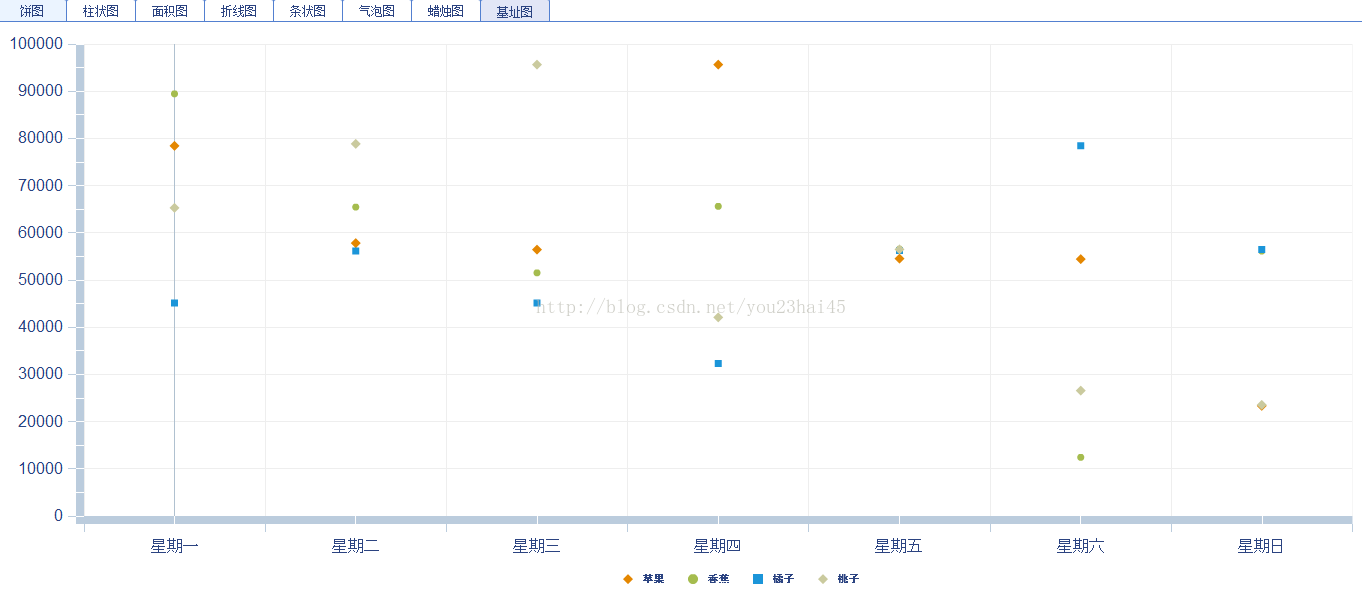
(8)基址图