Natural Language Processing with Python
Chapter 4.8
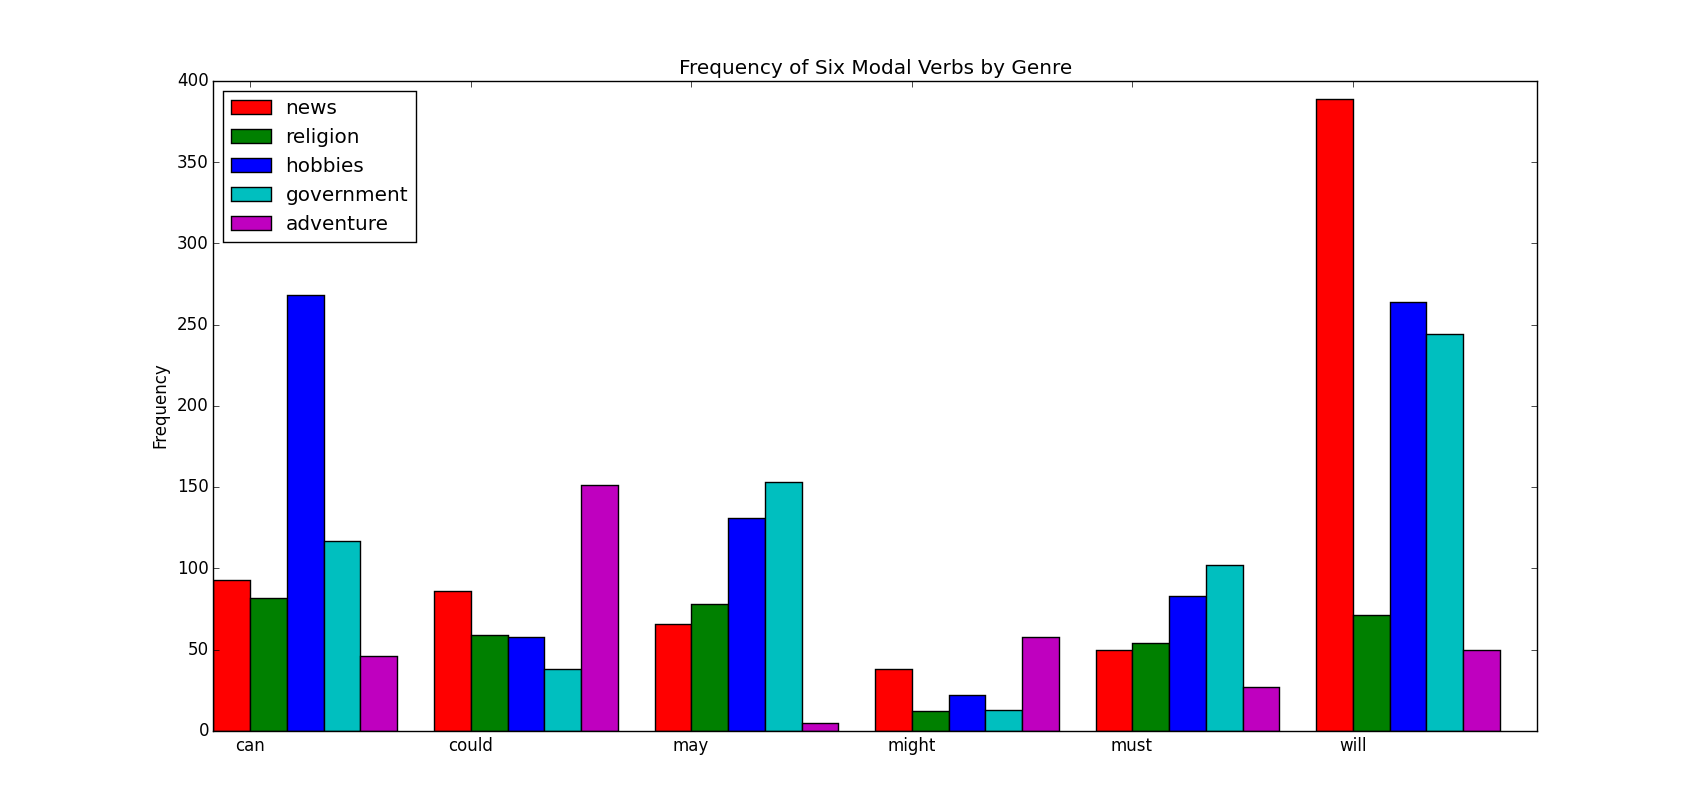
 1 colors = 'rgbcmyk' # red, green, blue, cyan, magenta, yellow, black
 2
 3 def bar_chart(categories, words, counts):
 4     "Plot a bar chart showing counts for each word by category"
 5     import pylab
 6
 7     ind = pylab.arange(len(words))
 8     width = 0.1*1 / (len(categories) + 1)*10
 9     bar_groups = []
10     for c in range(len(categories)):
11         bars = pylab.bar(ind+c*width, counts[categories[c]], width,
12                         color=colors[c % len(colors)])
13         bar_groups.append(bars)
14     pylab.xticks(ind+width, words)
15     pylab.legend([b[0] for b in bar_groups], categories, loc='upper left')
16     pylab.ylabel('Frequency')
17     pylab.title('Frequency of Six Modal Verbs by Genre')
18     pylab.show()
19
20 def test_bar_char():
21     genres = ['news', 'religion', 'hobbies', 'government', 'adventure']
22     modals = ['can', 'could', 'may', 'might', 'must', 'will']
23     cfdist = nltk.ConditionalFreqDist(
24                 (genre, word)
25                 for genre in genres
26                 for word in nltk.corpus.brown.words(categories=genre)
27                 if word in modals)
28     counts = {}
29     for genre in genres:
30         counts[genre] = [cfdist[genre][word] for word in modals]
31     bar_chart(genres, modals, counts)
修改了width,结果为: