聚类算法就是通过一个固定的准则将若干个数据分成不同的类,而这个准则就是算法,即分类的标准。
1.样本:
数据是这样的,300个数据点:
186.663    202.772
198.676    148.778
143.059    205.835
124.315    209.143
183.409    151.252
186.651    184.617
152.448    213.176
193.86    187.893
147.529    260.705
192.255    195.25
199.348    246.308
193.697    188.236
112.12    201.993
168.106    211.265
212.573    186.155
196.042    189.468
163.708    204.957
181.054    220.624
158.703    168.099
159.757    184.74
196.79    192.998
186.786    210.828
196.497    207.053
198.588    202.922
181.534    173.303
163.578    213.044
179.282    176.883
196.609    190.543
138.516    157.012
195.177    156.58
190.53    182.799
185.528    198.14
142.969    164.181
179.023    247.875
214.873    197.911
205.648    225.069
152.519    237.886
117.663    200.206
195.056    178.23
206.471    231.914
195.335    134.527
179.842    192.186
201.969    232.993
146.255    179.038
205.406    208.909
116.01    196.927
209.268    204.178
194.259    198.687
178.556    182.883
198.249    194.934
196.83    190.598
194.126    171.121
119.272    163.223
170.944    150.63
182.481    206.846
186.658    190.327
197.471    162.009
159.709    209.665
199.476    211.293
206.748    245.509
206.406    204.516
176.252    199.142
190.133    229.646
178.712    188.019
151.013    237.015
176.742    212.558
182.972    201.977
199.323    146.504
156.122    239.561
186.448    192.126
179.963    192.297
198.579    185.982
188.084    201.899
183.696    243.438
147.175    193.677
191.479    191.342
108.569    191.222
182.775    136.605
130.451    156.001
214.888    193.649
161.908    148.296
159.809    178.67
204.497    154.195
171.158    222.761
196.04    181.647
179.137    199.344
153.147    151.605
196.244    142.589
207.977    225.414
154.339    236.739
207.607    225.961
191.832    171.313
164.26    215.03
197.486    96.329
199.638    59.965
211.683    54.121
151.582    23.532
271.28    71.503
264.923    101.928
167.617    100.39
202.113    114.749
274.472    35.1
209.937    18.919
260.42    52.741
157.854    27.62
227.209    102.074
188.259    90.859
198.543    120.785
141.484    26.01
167.229    72.261
205.988    117.576
196.063    87.301
156.426    31.878
282.295    68.04
291.867    17.576
255.483    38.275
185.408    89.429
279.012    66.076
275.475    47.206
273.288    47.413
214.551    77.592
195.28    47.477
233.479    84.275
201.75    121.026
258.297    100.726
145.24    17.732
168.497    80.165
152.201    87.073
156.81    100.006
40.015    274.342
111.668    225.726
132.572    318.502
81.682    208.127
92.682    313.257
83.935    256.664
63.135    259.184
124.016    260.574
3.4    228.494
24.468    221.772
100.061    316.453
98.86    271.581
13.752    219.064
110.894    212.33
41.353    304.508
15.272    280.954
56.536    239.835
37.807    221.051
5.459    224.69
63.999    248.93
78.504    363.068
138.674    288.375
95.426    268.569
95.851    352.587
115.264    219.745
19.005    214.403
24.337    251.301
138.374    262.933
3.097    201.849
111.099    296.603
68.028    279.671
225.167    197.408
281.761    153.633
265.153    201.25
234.606    199.763
242.599    161.636
288.481    181.345
232.487    146.963
239.962    247.851
230.852    155.934
287.084    207.745
258.476    253.752
245.504    250.344
231.481    220.091
289.341    158.156
224.293    218.578
274.152    194.052
266.65    199.529
220.442    169.775
273.666    154.976
278.837    166.881
287.532    188.421
269.012    263.561
254.356    209.196
326.444    240.195
269.494    130.213
274.942    181.885
351.502    294.563
239.381    257.045
285.555    174.956
237.724    166.39
318.404    240.652
228.208    161.013
219.366    203.459
233.696    243.415
228.683    182.809
280.194    173.569
238.482    195.29
236.198    181.33
223.364    173.82
286.391    157.439
220.934    198.874
273.372    212.147
260.989    286.917
182.289    367.853
362.761    317.836
209.364    310.228
177.461    291.76
205.365    375.53
237.474    355.536
187.025    392.858
294.034    353.4
251.77    341.213
306.181    318.855
258.727    362.831
193.536    338.408
284.516    335.944
264.24    275.262
155.706    317.301
137.6    339.338
217.667    288.749
228.865    389.289
156.911    365.382
196.577    267.226
131.481    380.664
243.27    284.093
340.328    328.199
129.81    383.682
227.398    285.797
210.289    305.682
121.652    351.048
214.065    380.543
165.671    344.769
297.968    358.993
180.87    319.932
229.68    334.947
229.294    275.786
280.687    361.591
214.035    396.153
205.155    332.869
188.183    269.347
245.506    349.31
136.127    127.038
103.733    3.847
117.045    109.702
20.688    130.31
99.413    143.018
42.53    102.254
134.522    51.703
127.222    145.689
44.47    79.918
25.086    74.267
80.817    67.636
40.818    76.988
66.217    99.708
92.698    155.32
118.949    141.192
111.029    146.341
92.091    68.269
95.929    88.974
112.129    32.055
13.645    123.95
98.771    119.907
89.082    80.095
44.047    61.279
137.867    117.784
97.626    166.542
0    129.274
105.707    154.582
93.265    44.732
35.537    156.558
82.69    151.633
118.047    9.606
57.817    66.352
310.759    112.875
370.382    182.441
394.08    164.391
353.638    137.656
362.721    63.942
348.123    194.11
353.612    138.251
351.363    152.021
357.519    126.935
289.905    94.706
353.809    213.003
392.191    162.078
331.554    147.666
313.834    93.734
343.987    86.263
382.006    206.06
386.329    131.662
310.848    147.063
308.198    75.715
314.647    88.739
286.943    139.761
377.336    144.399
400    164.092
363.689    199.723
297.952    131.461
361.09    80.444
372.778    172.28
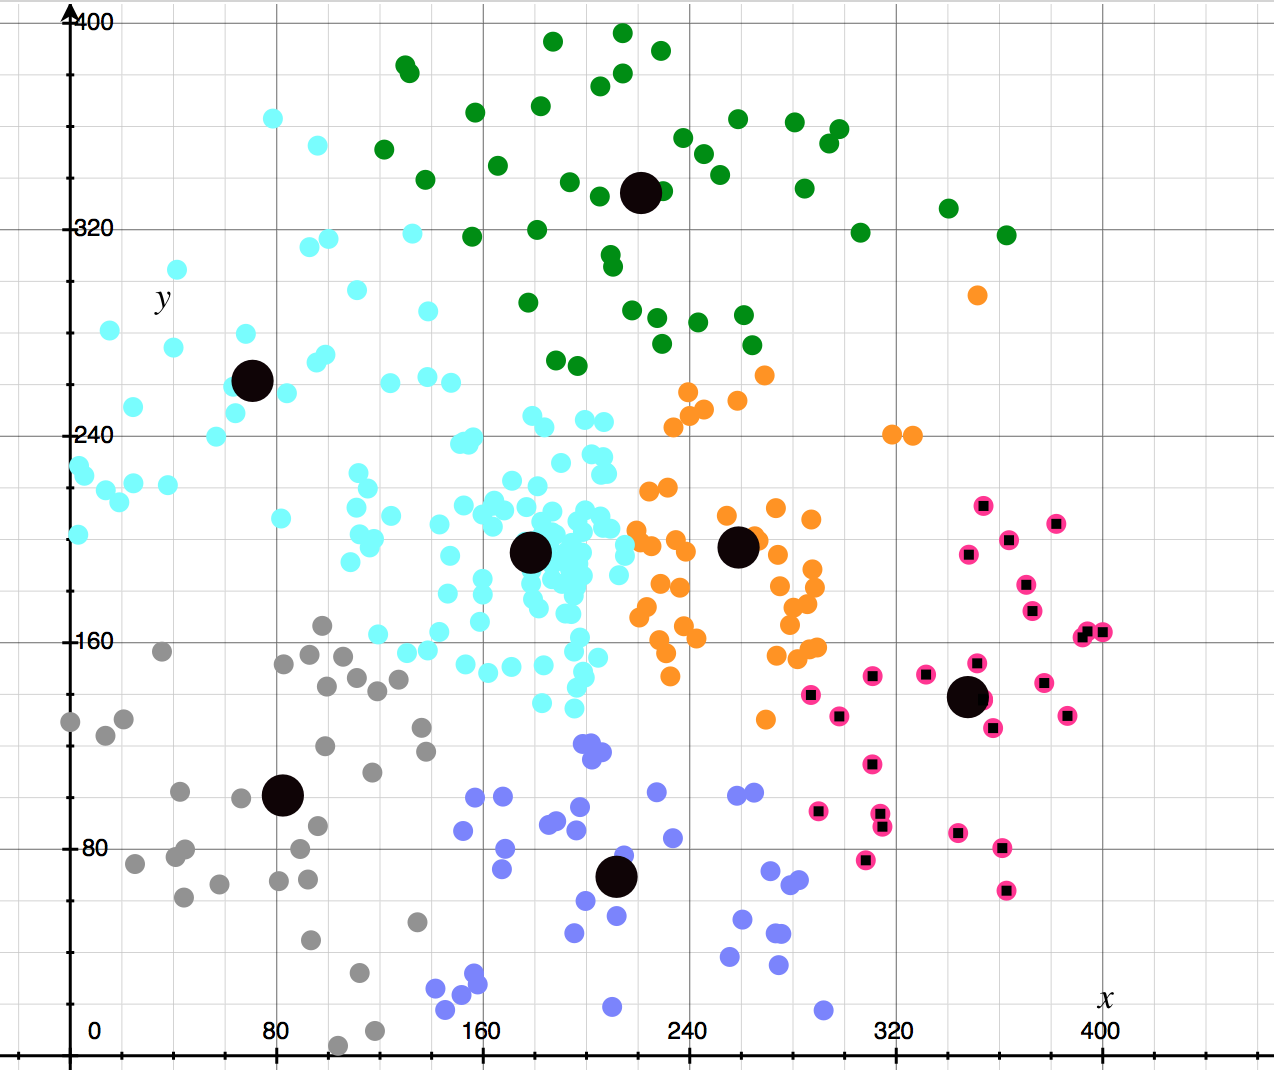
这些数据显示成图形,如下图:

如上图,这是三百个数据点,单凭肉眼看,我无法分别点和点,那个和哪个是同一类,这些点很没有规律,但是请看下图:

如上图:我便可以看清楚这个点与点之间是有联系的,经过连线我看到了点与点之间的关系,将它们可以分成七个类(簇),大致的块我都可以说出来,这些个点程序是怎么找出来的。
2.核心思想:
1. 将数据分为k个非空子集
2. 计算每个类中心点(k-means<centroid>中心点是所有点的average),记为seed point
3. 将每个object聚类到最近seed point
4. 返回2,当聚类结果不再变化的时候stop
代码:来自于维基百科:
#!/usr/bin/python
# -*- coding: UTF-8 -*-

from math import pi, sin, cos
from collections import namedtuple
from random import random, choice
from copy import copy

try:
    import psyco

    psyco.full()
except ImportError:
    pass

FLOAT_MAX = 1e100


class Point:
    __slots__ = ["x", "y", "group"]

    def __init__(self, x=0.0, y=0.0, group=0):
        self.x, self.y, self.group = x, y, group


"""
创建数据源,先初始化300个点对象,再循环赋值
"""
def generate_points(npoints, radius):
    points = [Point() for _ in xrange(npoints)]

    # note: this is not a uniform 2-d distribution
    for p in points:
        r = random() * radius
        ang = random() * 2 * pi
        p.x = r * cos(ang)
        p.y = r * sin(ang)

    return points


def nearest_cluster_center(point, cluster_centers):
    """Distance and index of the closest cluster center"""

    def sqr_distance_2D(a, b):
        return (a.x - b.x) ** 2 + (a.y - b.y) ** 2

    min_index = point.group
    min_dist = FLOAT_MAX

    for i, cc in enumerate(cluster_centers):
        d = sqr_distance_2D(cc, point)
        if min_dist > d:
            min_dist = d
            min_index = i

    return (min_index, min_dist)


'''
points是数据点,nclusters是给定的簇类数目
cluster_centers包含初始化的nclusters个中心点,开始都是对象->(0,0,0)
'''


def kpp(points, cluster_centers):
    cluster_centers[0] = copy(choice(points)) #随机选取第一个中心点
    d = [0.0 for _ in xrange(len(points))] #列表,长度为len(points),保存每个点离最近的中心点的距离

    for i in xrange(1, len(cluster_centers)): # i=1...len(c_c)-1
        sum = 0
        for j, p in enumerate(points):
            d[j] = nearest_cluster_center(p, cluster_centers[:i])[1]#第j个数据点p与各个中心点距离的最小值
            sum += d[j]

        sum *= random()

        for j, di in enumerate(d):
            sum -= di
            if sum > 0:
                continue
            cluster_centers[i] = copy(points[j])
            break

    for p in points:
        p.group = nearest_cluster_center(p, cluster_centers)[0]

'''
points是数据点,nclusters是给定的簇类数目
'''
def lloyd(points, nclusters):
    cluster_centers = [Point() for _ in xrange(nclusters)]#根据指定的中心点个数,初始化中心点,均为(0,0,0)

    # call k++ init
    kpp(points, cluster_centers) #选择初始种子点

    lenpts10 = len(points) >> 10

    changed = 0
    while True:
        # group element for centroids are used as counters
        for cc in cluster_centers:
            cc.x = 0
            cc.y = 0
            cc.group = 0

        for p in points: #与该种子点在同一簇的数据点的个数
            cluster_centers[p.group].group += 1
            cluster_centers[p.group].x += p.x
            cluster_centers[p.group].y += p.y

        for cc in cluster_centers:#生成新的中心点
            cc.x /= cc.group
            cc.y /= cc.group

        # find closest centroid of each PointPtr
        changed = 0 #记录所属簇发生变化的数据点的个数
        for p in points:
            min_i = nearest_cluster_center(p, cluster_centers)[0]
            if min_i != p.group:
                changed += 1
                p.group = min_i

        # stop when 99.9% of points are good
        if changed <= lenpts10:
            break

    for i, cc in enumerate(cluster_centers):
        cc.group = i

    return cluster_centers


def print_eps(points, cluster_centers, W=400, H=400):
    Color = namedtuple("Color", "r g b");

    colors = []
    for i in xrange(len(cluster_centers)):
        colors.append(Color((3 * (i + 1) % 11) / 11.0,
                            (7 * i % 11) / 11.0,
                            (9 * i % 11) / 11.0))

    max_x = max_y = -FLOAT_MAX
    min_x = min_y = FLOAT_MAX

    for p in points:
        if max_x < p.x: max_x = p.x
        if min_x > p.x: min_x = p.x
        if max_y < p.y: max_y = p.y
        if min_y > p.y: min_y = p.y

    scale = min(W / (max_x - min_x),
                H / (max_y - min_y))
    cx = (max_x + min_x) / 2
    cy = (max_y + min_y) / 2

    print "%%!PS-Adobe-3.0
%%%%BoundingBox: -5 -5 %d %d" % (W + 10, H + 10)

    print ("/l {rlineto} def /m {rmoveto} def
" +
           "/c { .25 sub exch .25 sub exch .5 0 360 arc fill } def
" +
           "/s { moveto -2 0 m 2 2 l 2 -2 l -2 -2 l closepath " +
           "   gsave 1 setgray fill grestore gsave 3 setlinewidth" +
           " 1 setgray stroke grestore 0 setgray stroke }def")

    for i, cc in enumerate(cluster_centers):
        print ("%g %g %g setrgbcolor" %
               (colors[i].r, colors[i].g, colors[i].b))

        for p in points:
            if p.group != i:
                continue
            print ("%.3f %.3f c" % ((p.x - cx) * scale + W / 2,
                                    (p.y - cy) * scale + H / 2))

        print ("
0 K中心 %g %g s" % ((cc.x - cx) * scale + W / 2,
                                        (cc.y - cy) * scale + H / 2))

    print "
%%%%EOF"


def main():
    npoints = 300
    k = 7  # # clusters

    points = generate_points(npoints, 10)
    cluster_centers = lloyd(points, k)
    print_eps(points, cluster_centers)


main()
3.计算结果:
计算出的7个点是:

数据视图:
178.432	194.88
211.643	69.3258
70.6203	261.456
258.91	196.902
221.139	334.234
82.3629	100.829
347.752	138.943
全局分类结果:
结果二:
