前言
leaflet 入门开发系列环境知识点了解:
- leaflet api文档介绍,详细介绍 leaflet 每个类的函数以及属性等等
- leaflet 在线例子
- leaflet 插件,leaflet 的插件库,非常有用
内容概览
leaflet聚合图功能
源代码demo下载
效果图如下: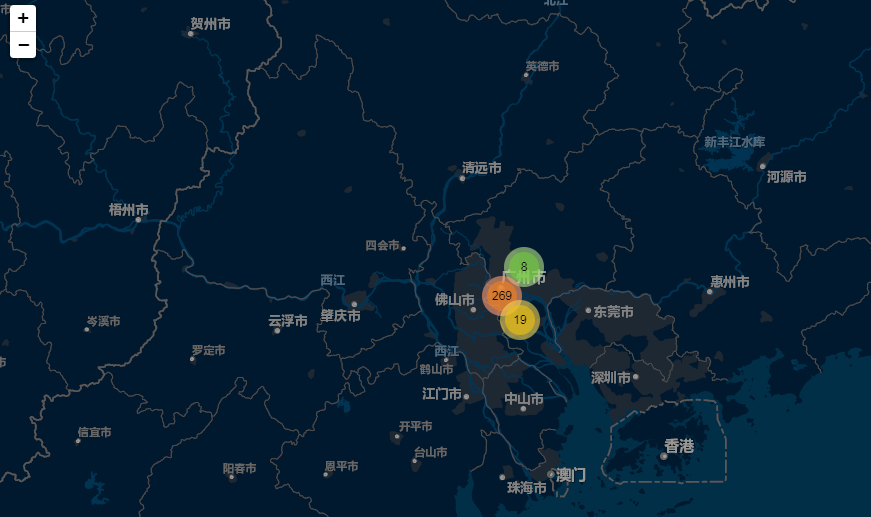
本篇主要参考leaflet官网聚合效果插件Leaflet.markercluster:https://github.com/Leaflet/Leaflet.markercluster
这个聚合插件具体使用看github地址,那里有详细说明以及例子。
- 模拟数据geojson格式如下:
var geojson = {"type":"FeatureCollection", "features": [
{"type":"Feature","geometry":{"type":"Point","coordinates":[113.16305738210656,23.13667404697526]},"properties":{"Name_CHN":"赤岗塔","StationNum":1,"Status":1}},
{"type":"Feature","geometry":{"type":"Point","coordinates":[113.18383377370634,23.100037587172096]},"properties":{"Name_CHN":"海心沙","StationNum":2,"Status":1}},
……
]};
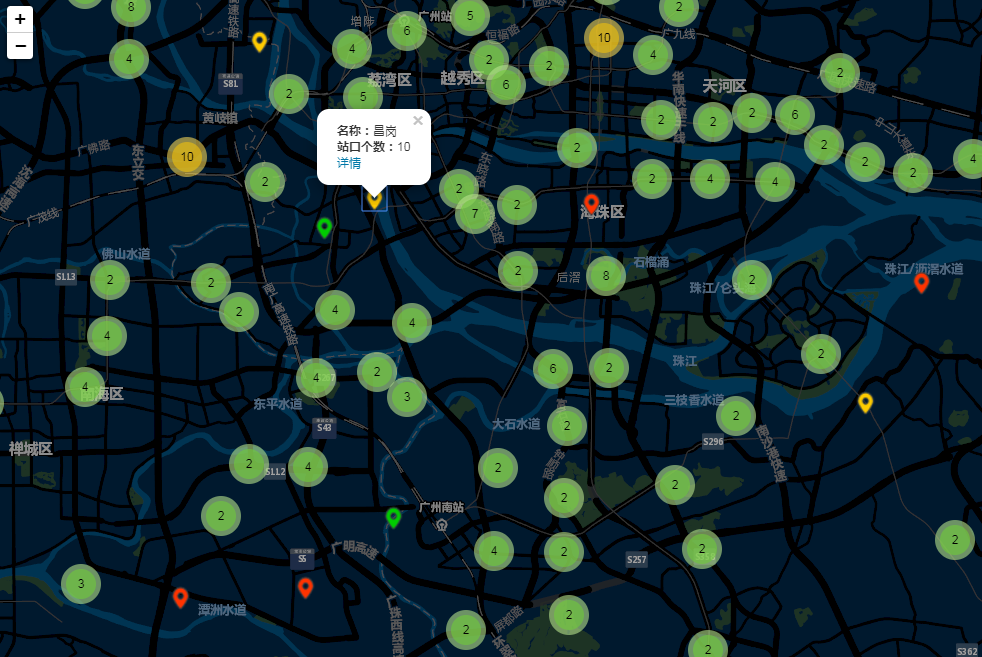
- 放大地图到一定级别,根据模拟数据的属性值Status不同,对应不同类型的图标:
//根据Status类型不同加载不同图标
var img = './img/projectPoint_HGX.png';
switch(properties.Status) {
case 1:
img = './img/projectPoint_HGX.png';
break;
case 2:
img = './img/projectPoint_JSZT.png';
break;
case 3:
img = './img/projectPoint_XMXZ.png';
break;
case 4:
img = './img/projectPoint_XMZS.png';
break;
}
var myIcon = L.icon({
iconUrl: img,
iconSize: [25, 25],
});
var marker = L.marker(new L.LatLng(coordinate[1], coordinate[0]), {
properties: properties,
icon: myIcon,
});
- 部分核心代码,完整的见源码demo下载
var map = L.map('map'); L.tileLayer('http://map.geoq.cn/ArcGIS/rest/services/ChinaOnlineStreetPurplishBlue/MapServer/tile/{z}/{y}/{x}').addTo(map); map.setView(L.latLng(22.95186415, 113.90271877), 9); //设置缩放级别及中心点 //聚合图 var projectPointLayer = L.markerClusterGroup({ showCoverageOnHover: false, zoomToBoundsOnClick: true, chunkedLoading: true, maxClusterRadius: 40, //默认80 }).addTo(map); if (geojson) { addProjectClusterLayers(geojson, projectPointLayer); projectPointLayer.on("click", function (e) { e.layer.unbindPopup(); var elements = getProjectPopupContent( e.layer.options.properties ); e.layer.bindPopup(elements[0]).openPopup(e.latlng); }); } /* * 点单击内容函数 */ function getProjectPopupContent(item) { const { toPopupItemStr } = this; const me = this; // 内容及单击事件 const elements = $( `<div> ${toPopupItemStr("名称", item.Name_CHN)} ${toPopupItemStr("站口个数", item.StationNum)} <a class="edit">详情</a> </div>` ); return elements; } // 转为popup项 function toPopupItemStr(name, value){ return value ? `<b>${name}:</b>${value}<br>` : ""; }; /* * 加载聚合图层 */ function addProjectClusterLayers(geojson, clusterlayer) { var markerList = []; if (geojson.features.length > 0) { for (var i = 0; i < geojson.features.length; i++) { if (geojson.features[i].geometry) { var properties = geojson.features[i].properties; var coordinate = geojson.features[i].geometry.coordinates; //根据Status类型不同加载不同图标 var img = './img/projectPoint_HGX.png'; switch(properties.Status) { case 1: img = './img/projectPoint_HGX.png'; break; case 2: img = './img/projectPoint_JSZT.png'; break; case 3: img = './img/projectPoint_XMXZ.png'; break; case 4: img = './img/projectPoint_XMZS.png'; break; } var myIcon = L.icon({ iconUrl: img, iconSize: [25, 25], }); var marker = L.marker(new L.LatLng(coordinate[1], coordinate[0]), { properties: properties, icon: myIcon, }); markerList.push(marker); } } } clusterlayer.addLayers(markerList); };
完整demo源码见小专栏文章尾部:小专栏
文章尾部提供源代码下载,对本专栏感兴趣的话,可以关注一波