ELKStack简介
对于日志来说,最常见的需求就是收集、存储、查询、展示,开源社区正好有相对应的开源项目:logstash(收集)、elasticsearch(存储+搜索)、kibana(展示),我们将这三个组合起来的技术称之为ELKStack,所以说ELKStack指的是Elasticsearch、Logstash、Kibana技术栈的结合,一个通用的架构如下图所示:

YUM安装ElasticSearch
1.下载并安装GPG key
[root@hadoop-node1 ~]# rpm --import https://packages.elastic.co/GPG-KEY-elasticsearch
2.添加yum仓库
[root@hadoop-node1 ~]# vim /etc/yum.repos.d/elasticsearch.repo
[elasticsearch-2.x]
name=Elasticsearch repository for 2.x packages
baseurl=http://packages.elastic.co/elasticsearch/2.x/centos
gpgcheck=1
gpgkey=http://packages.elastic.co/GPG-KEY-elasticsearch
enabled=1
3.安装elasticsearch
[root@hadoop-node1 ~]# yum install -y elasticsearch
LogStash部署与配置
和Elasticsearch一样,在开始部署LogStash之前也需要你的环境中正确的安装的JDK。可以下载安装Oracle的JDK或者使用 yum安装openjdk。
安装JDK
[root@linux-node1 ~]# yum install -y java
[root@linux-node1 ~]# java -version
openjdk version "1.8.0_65"
OpenJDK Runtime Environment (build 1.8.0_65-b17)
OpenJDK 64-Bit Server VM (build 25.65-b01, mixed mode)
YUM部署LogStash
1.下载并安装GPG key
[root@linux-node2 ~]# rpm --import https://packages.elastic.co/GPG-KEY-elasticsearch
2.添加yum仓库
[root@linux-node2 ~]# vim /etc/yum.repos.d/logstash.repo
[logstash-2.3]
name=Logstash repository for 2.3.x packages
baseurl=https://packages.elastic.co/logstash/2.3/centos
gpgcheck=1
gpgkey=https://packages.elastic.co/GPG-KEY-elasticsearch
enabled=1
3.安装logstash
[root@linux-node2 ~]# yum install -y logstash
Kibana简介
Kibana 是为 Elasticsearch 设计的开源分析和可视化平台。你可以使用 Kibana 来搜索,查看存储在 Elasticsearch 索引中的数据并与之交互。你可以很容易实现高级的数据分析和可视化,以图表的形式展现出来。
Yum安装Kibana
1.下载并安装GPG key
[root@linux-node2 ~]# rpm --import https://packages.elastic.co/GPG-KEY-elasticsearch
2.添加yum仓库
[root@test ~]# vim /etc/yum.repos.d/kibana.repo
[kibana-4.5]
name=Kibana repository for 4.5.x packages
baseurl=http://packages.elastic.co/kibana/4.5/centos
gpgcheck=1
gpgkey=http://packages.elastic.co/GPG-KEY-elasticsearch
enabled=1
3.安装kibana
[root@test ~]# yum install -y kibana

修改配置文件
cd /etc/elasticsearch
vim vim elasticsearch.yml
以下是修改的内容

启动(启动前修改权限否则启动不了chown -R elasticsearch.elasticsearch /data/es-data/)
systemctl start elasticsearch
PS:如果启动报错无法分配内存把bootstrap.memory_lock: 参数true改成false
访问测试


搜索
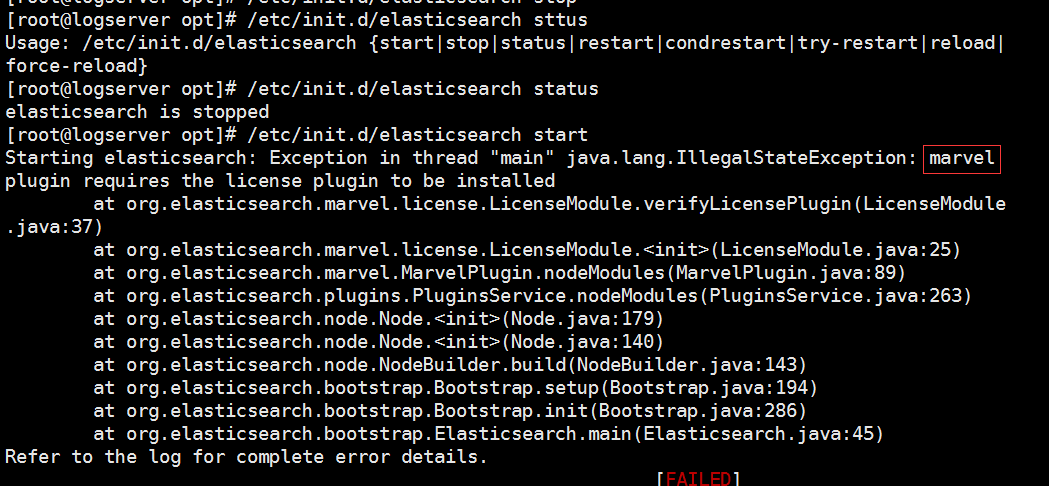
安装插件marvel
/usr/share/elasticsearch/bin/plugin install marvel-agent安装好在这个目录/usr/share/elasticsearch/plugins/
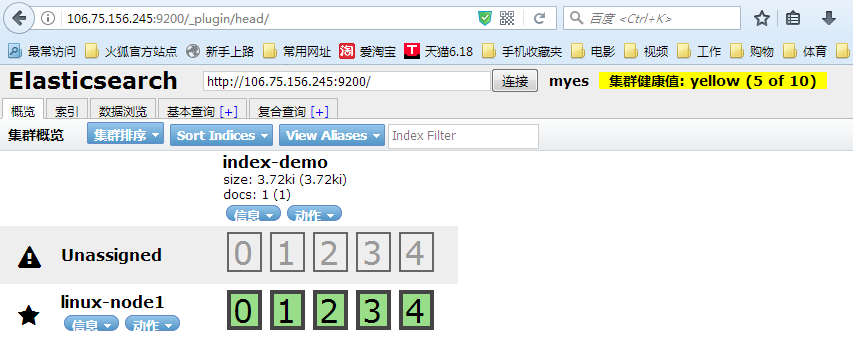
安装head插件
/usr/share/elasticsearch/bin/plugin install mobz/elasticsearch-head

这两插件是用来做集群管理
访问方式
http://106.75.156.245:9200/_plugin/head/

安装插件bigdesk
/usr/share/elasticsearch/bin/plugin install lukas-vlcek/bigdesk
PS:安装不上,版本不支持
安装插件kopf
/usr/share/elasticsearch/bin/plugin install lmenezes/elasticsearch-kopf
访问
http://106.75.156.245:9200/_plugin/kopf

PS:如果安装插件失败启动elasticsearch可能报错
解决办法 去/usr/share/elasticsearch 目录删掉对应的文件夹即可
打开head插入数据


ELKStack集群
另外一台服务器也安装相同
拷贝配置文件
scp /etc/elasticsearch/elasticsearch.yml root@10.13.141.148:/etc/elasticsearch/
修改一下
cluster.name要保持一致为myes
node-name改为linux-node2
network.host改为10.13.141.148
创建目录
mkdir /data/es-data
授权
chown -R elasticsearch.elasticsearch /data/es-data/
查看

启动
etc/init.d/elasticsearch start
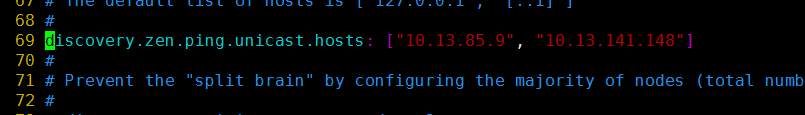
elasticsearch使用组播的方式进行查找 根据cluster名称发送组播,选举出一个主节点(master用来管理集群的状态)
打开head查看是否组成了集群(如未组成改成单波模式)

PS:粗一点的是主分片前面是星号,细一点是从分片,前面是圆圈,任意一个节点故障都不会影响
监控集群健康状态

logstash实战
日志的收集
默认安装位置/opt/logstash
/opt/logstash/bin/logstash -e 'input { stdin{} } output { stdout{} }'
启动一会
标准输入什么输出什么

以json方式输出
/opt/logstash/bin/logstash -e 'input { stdin{} } output { stdout{ codec => rubydebug } }'

PS:这里等号是使用=>
输出到es
/opt/logstash/bin/logstash -e 'input { stdin{} } output { elasticsearch { hosts => ["10.13.85.9:9200"] index => "logstash-%{+YYYY.MM.dd}" } }'
输入hehe 不显示
页面显示

既在屏幕上面输出又输入到es
/opt/logstash/bin/logstash -e 'input { stdin{} } output { stdout { codec => rubydebug } elasticsearch { hosts => ["10.13.85.9:9200"] index => "logstash-%{+YYYY.MM.dd}" } }'

yum安装的配置文件位置/etc/logstash/conf.d
因为脚本 /etc/init.d/logstash 指定了
写一个配置文件
vim demo.conf
input{
    stdin{}

}

filter{
}

output{
    elasticsearch{
	hosts => ["10.13.85.9:9200"]
	index => "logstash-%{+YYYY.MM.dd}"
    }
    stdout{
   	codec => rubydebug
    }
}
加配置文件启动
/opt/logstash/bin/logstash -f /etc/logstash/conf.d/demo.conf
PS:配置文件必须包含input和output filter是可选的,每个里面放置各自的插件,每个插件也有大括号包含。
写一个收集文件日志的配置文件
vim file.conf
input{
    file{
   	path => ["/var/log/messages","/var/log/secure"]
	type => "system-log"
	start_position => "beginning"
    }

}

filter{

}

output{
    elasticsearch{
	hosts => ["10.13.85.9:9200"]
	index => "system-log-%{+YYYY.MM}"
    }


}
启动
/opt/logstash/bin/logstash -f /etc/logstash/conf.d/file.conf
查看数据


排错:启动logstash时候出现Could not find any executable java binary. Please install java in your PATH or set JAVA_HOME
解决办法
export JAVACMD=`which java`
kibana简单使用
配置文件目录
/opt/kibana/config

启动
/etc/init.d/kibana start
访问
http://106.75.156.245:5601
根据索引导入日志数据

logstash-input-if判断
加一个文件收集日志
如果没有定下输出将和之前的system-log日志输出到一起,如果在output写一个对应的输出则会同时输出到两个设置里面
需要通过if判断来区分
修改后的配置文件file.conf
input{
    file{
   	path => ["/var/log/messages","/var/log/secure"]
	type => "system-log"
	start_position => "beginning"
    }
    file{
	path => "/var/log/elasticsearch/myer.log"
	type => "es-log"
        start_position => "beginning"
}

}

filter{

}

output{
	if [type] == "system-log" {
	elasticsearch{
	    hosts => ["10.13.85.9:9200"]
	    index => "system-log-%{+YYYY.MM}"
       }
       }
	if [type] == "es-log"{
    elasticsearch{
	hosts => ["10.13.85.9:9200"]
	index => "es-log-%{+YYYY.MM}"
    }
   }
}
multiline插件
多行插件
先标准输出验证一下
vim /etc/logstash/conf.d/codec.conf
input{
    stdin {
	codec => multiline{
	    pattern => "^["
	    negate => true
	    what => "previous"
           }
          }
}

filter{
}

output{
    stdout{
	codec => rubydebug
     }
}
运行/opt/logstash/bin/logstash -f /etc/logstash/conf.d/codec.conf

只要遇到中括号就把上面的合并
修改file.conf
input{
    file{
        path => ["/var/log/messages","/var/log/secure"]
        type => "system-log"
        start_position => "beginning"
    }
    file{
        path => "/var/log/elasticsearch/myes.log"
        type => "es-log"
        start_position => "beginning"
        codec => multiline{
            pattern => "^["
            negate => true
            what => "previous"
        }
}

}

filter{

}

output{
    if [type] == "system-log" {
        elasticsearch{
            hosts => ["10.13.85.9:9200"]
            index => "system-log-%{+YYYY.MM}"
       }
       }
    if [type] == "es-log" {
        elasticsearch{
            hosts => ["10.13.85.9:9200"]
            index => "es-log-%{+YYYY.MM}"
    }
   }
}
删除掉原来的es-log
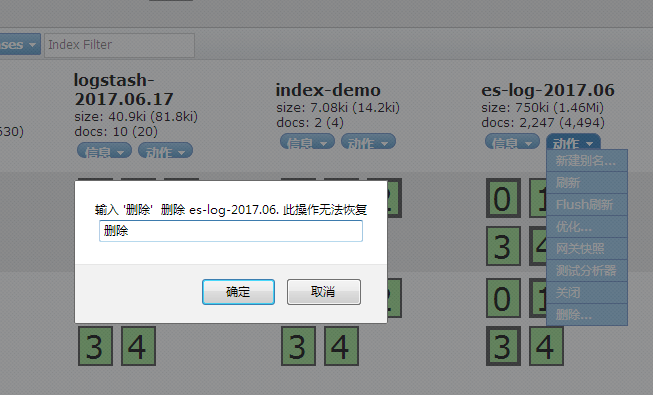
重新启动生成索引(需要重启elasticserach)
codes-json
把nginx访问日志改成json的输出
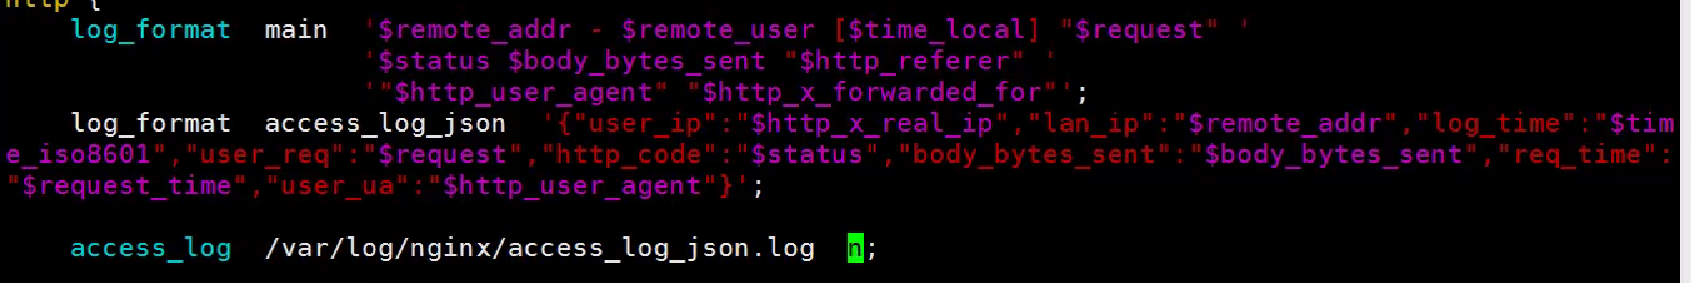
PS:还可使用文件直接收取 Redis Python脚本读取Redis,写成Json,写入ES
重启nginx
写收集日志配置文件
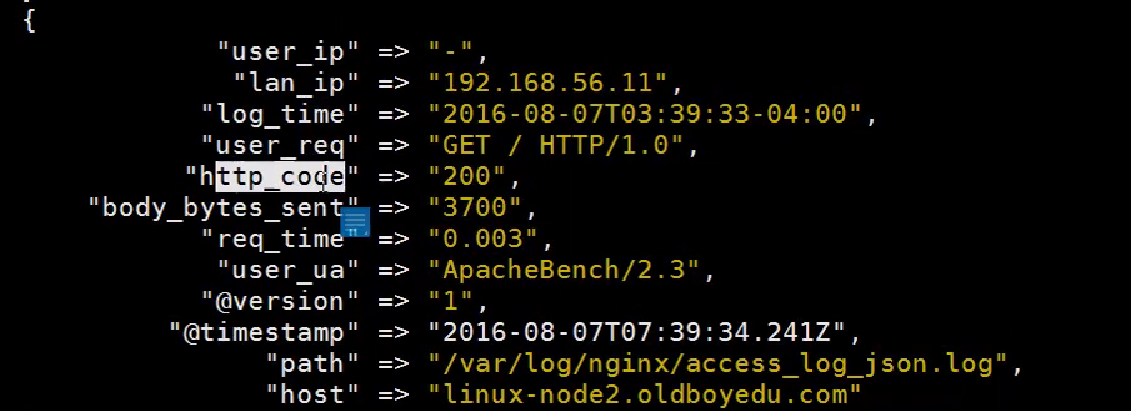
先写屏幕输出的
input{
    file{
        path => "/usr/local/nginx/log/access_log_json.log"
        codec => "json"
}
}

filter{

}

output{
    stdout{
        codec =>rubydebug
    }
}
启动 输出为
修改为输出到es
input{
    file{
        path => "/usr/local/nginx/log/access_log_json.log"
        codec => "json"
}
}

filter{

}

output{
    elasticsearch{
        hosts => ["10.13.85.9:9200"]
        index => "nginx-log-%{+YYYY.MM.dd}"
    }
}
PS:如果之前做过屏幕输出测试需要删除sincedb否则可能收取不到,如果找不到哪里的问题可以在配置文件设置stdout进行调试,可以使用-t参数测试配置文件
加入kibana
