查询线程及相关信息
show full processlist
修改慢查询的设置时间为6秒
set long_query_time=6
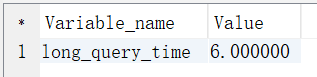
显示当前慢查询设置的时间
show variables like 'long_query_time'
查看查询时间超过long_query_time秒的查询的个数
show global status like "slow_queries"
查看general_log相关信息
show variables like '%general_log%';
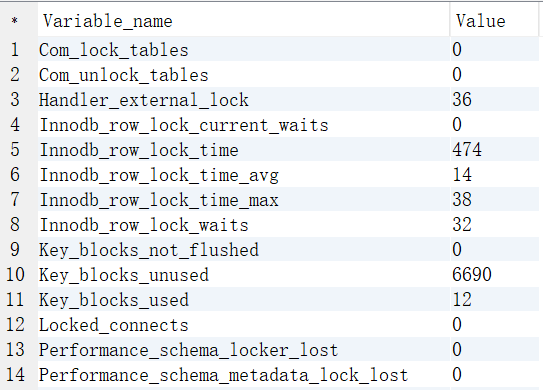
查看服务器状态
show status like '%lock%';
查看有没有执行时间特别长的线程
select * from information_schema.processlist where Command != 'Sleep' order by Time desc;
找出所有执行时间超过 6分钟的线程,拼凑出 kill 语句,方便后面查杀 (此处 6分钟 可根据自己的需要调整SQL标红处)
可复制查询结果到控制台,直接执行,杀死堵塞进程
select concat('kill ', id, ';') from information_schema.processlist where Command != 'Sleep' and Time > 360 order by Time desc;
按客户端 IP 分组,查看哪个客户端的链接数最多
select client_ip,count(client_ip) as client_num from (select substring_index(host,':' ,1) as client_ip from information_schema.processlist ) as connect_info group by client_ip order by client_num desc;