说起自动化运维离不开监控软件,那我们就用一点时间来写一个主机性能监控系统吧,Python+Django使用HighChart.js可以很快实现性能监控的功能:
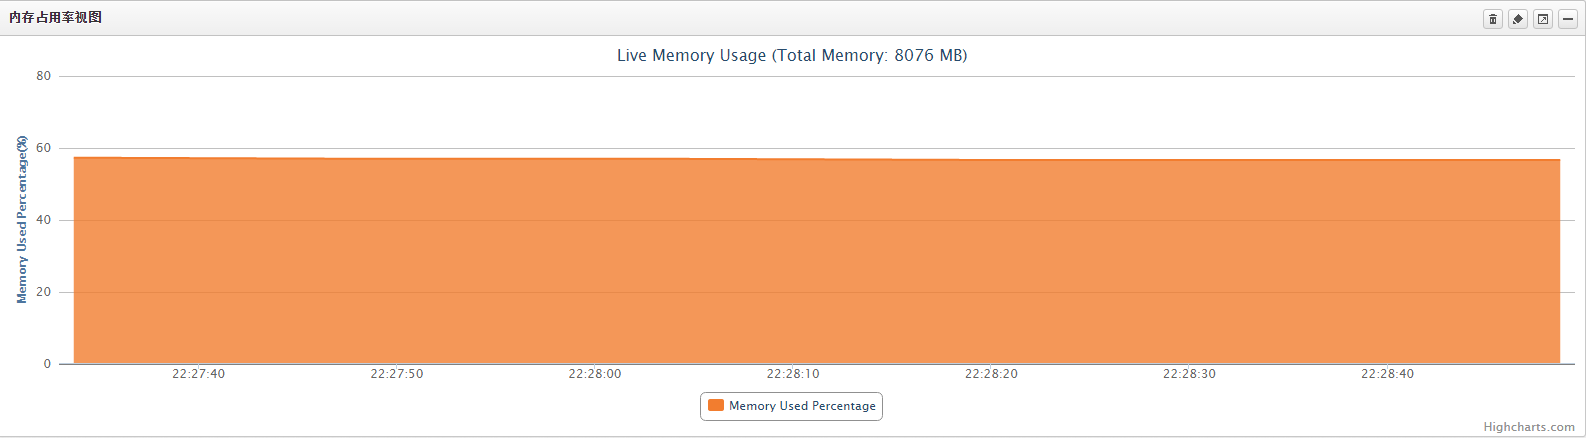
以下为监控视图效果。本机总内存8G,内存占用一直比较稳定在55%~58%之间,所以图形曲线非常平缓~。
内存监控使用Ajax和Python第三方插件以及HighChart.js生成监控视图:
前台Ajax和HighChart.js引用代码如下:


    Highcharts.setOptions({
        global: {
            useUTC: false
        }
    });
    var totalmem = 0,usedmem = 0;
    $.ajax({
        url:"/getMemInfo/",
        async:false,
        success:function(data){
            var jsondata= JSON.parse(data);
            totalmem = jsondata.total_mem;
            usedmem = jsondata.used_mem;
        }

    });
    var chart;
    $("#memusage-container").highcharts({
        chart: {
            type: 'area',
            marginRight: 10,
            events: {
                load: function() {
                    // set up the updating of the chart each second
                    var series0 = this.series[0];// ,series1= this.series[1];
                    setInterval(function() {
                        var x = (new Date()).getTime(), // current time
                           y = Math.random(),system=Math.random();
                        $.ajax({
                            url:"/getMemInfo/",
                            async:false,
                            success:function(data){
                                var jsondata= JSON.parse(data);
                                y = jsondata.used_mem;
                            }

                        });
                        series0.addPoint([x, y], true, true);
                    //    series1.addPoint([x,system],true,true);
                    }, 15000);
                }
            }
        },
        title: {
            text: "Live Memory Usage (Total Memory: " + totalmem+" MB)"
        },
        xAxis: {
            type: 'datetime',
            tickPixelInterval: 150
        },
        yAxis: {
            title: {
                text: 'Memory Used Percentage(%)',
            },
            plotLines: [{
                value: 0,
                 1,
                color: '#808080'
            }]
        },
        tooltip: {
            formatter: function() {
                    return '<b>'+ this.series.name +'</b><br/>'+
                    Highcharts.dateFormat('%Y-%m-%d %H:%M:%S', this.x) +'<br/>'+
                    Highcharts.numberFormat(this.system, 2);
            }
        },
        legend: {
            enabled:true
        },
        backgroundColor: '#dddddd',
        plotOptions:{
            area:{
            //    marker:{enabled:false},
            //    linecolor:'#000',
                color:'#f27d2f',
            //    fillColor:'#ecae3d',
                fillOpacity:0.8,

                marker: {
                        enabled: false,
                        symbol: 'circle',
                        radius: 2,
                        states: {
                            hover: {
                                enabled: true
                            }
                        }
                    }
            }
        },
        exporting: {
            enabled: false
        },
        series: [
            {
                name: 'Memory Used Percentage',
                data: (function() {
                    // generate an array of random data
                    var data = [],
                        time = (new Date()).getTime(),
                        i;

                    for (i = -5; i <= 0; i++) {
                        data.push({
                            x: time + i * 1000,
                            y: usedmem
                        });
                    }
                    return data;
                })()
            }

        ]

});
后台getMeminfo函数调用了psutil的virtual_meory()方法
def getMemInfo(request):
    m = psutil.virtual_memory()
    total_mem = m.total / 1024 / 1024
    used_mem_percentage = m.percent
    free_mem_percentage = 100 - m.percent
    print '{"total_mem":%s,"used_mem": %s,"free_mem":%s}' % (total_mem, used_mem_percentage, free_mem_percentage)
    return HttpResponse(
        '{"total_mem":%s,"used_mem": %s,"free_mem":%s}' % (total_mem, used_mem_percentage, free_mem_percentage))
实现效果如下图:
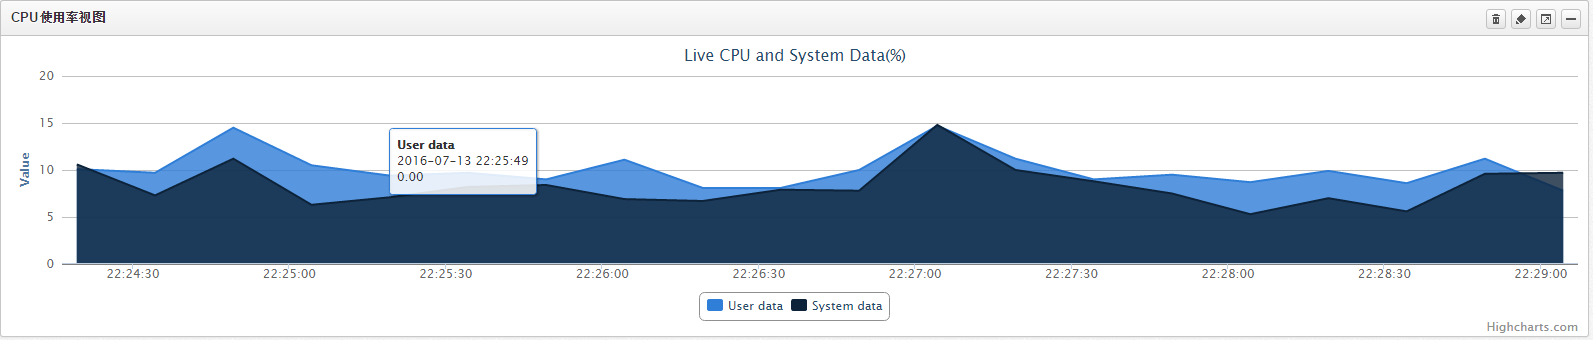
CPU性能视图,使用Ajax和Python第三方插件以及HighChart.js生成监控视图:
前台Ajax和HighChart.js引用代码如下:
var usrcpu =0,systemcpu =0;
         $.ajax({
                 url:"/getCPUInfo/",
                 async:false,
                 success:function(data){
                              var jsondata= JSON.parse(data);
                              usrcpu = jsondata.user;
                              systemcpu = jsondata.system;
                         }

                });

$("#container").highcharts({
        chart: {
            type: 'area',
//                animation: Highcharts.svg, // don't animate in old IE
            marginRight: 10,
            events: {
                load: function() {

                    // set up the updating of the chart each second
                    var series0 = this.series[0],series1= this.series[1];
                    setInterval(function() {
                        var x = (new Date()).getTime(), // current time
                           y = Math.random(),system=Math.random();
            $.ajax({
                url:"/getCPUInfo/",
                async:false,
                success:function(data){
                        var jsondata= JSON.parse(data);
                        y = jsondata.user;
                        system = jsondata.system;
                }

            });
//                alert('x and y is :'+x+","+y);

                series0.addPoint([x, y], true, true);
                series1.addPoint([x,system],true,true);
                    }, 15000);
                }
            }
        },
        title: {
            text: "Live CPU and System Data(%)"
        },
        xAxis: {
            type: 'datetime',
            tickPixelInterval: 150
        },
        yAxis: {
            title: {
                text: 'Value'
            },
            plotLines: [{
                value: 0,
                 1,
                color: '#808080'
            }]
        },
        tooltip: {
            formatter: function() {
                    return '<b>'+ this.series.name +'</b><br/>'+
                    Highcharts.dateFormat('%Y-%m-%d %H:%M:%S', this.x) +'<br/>'+
                    Highcharts.numberFormat(this.system, 2);
            }
        },
        legend: {
            enabled:true
        },
        plotOptions:{
            area:{
            //    fillColor:'#ecae3d',
                fillOpacity:0.8,

                marker: {
                        enabled: false,
                        symbol: 'circle',
                        radius: 2,
                        states: {
                            hover: {
                                enabled: true
                            }
                        }
                }
            }

        },
        exporting: {
            enabled: false
        },
        series: [{
            name: 'User data',
            data: (function() {
                // generate an array of random data
                var data = [],
                    time = (new Date()).getTime(),
                    i;

                for (i =-19 ; i <= 0; i++) {
                    data.push({
                        x: time + i * 1000,
                        y: usrcpu //Math.random()
                    });
                }
                return data;
            })(),
        //    color:'#f28f43'
        },
        {name:'System data',
        data:(function(){
            var data=[],
            time =(new Date()).getTime(),
            i;
            for(i=-19;i<=0;i++){
                data.push({
                    x:time + i*1000,
                    y:systemcpu//Math.random()
                });
            }
            return data;
        })(),
        //color:'#492970'
        }
]
    });
后台getCPUinfo函数使用的psutil插件的cpu_time_percent方法:
def getCPUInfo(request):
    a = psutil.cpu_times_percent()
    user_percentage = a.user
    system_percentage = a.system
    print "user and system are ", user_percentage, system_percentage
    return HttpResponse('{"user": %s,"system":%s}' % (user_percentage, system_percentage))
实现效果如下:CPU使用率监控视图,CPU使用率波动频繁,所以效果很好:
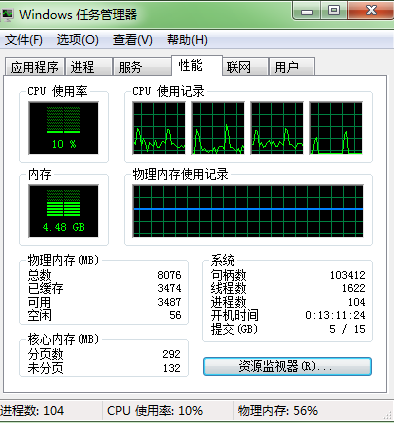
贴上任务管理器中的监控对比一下。
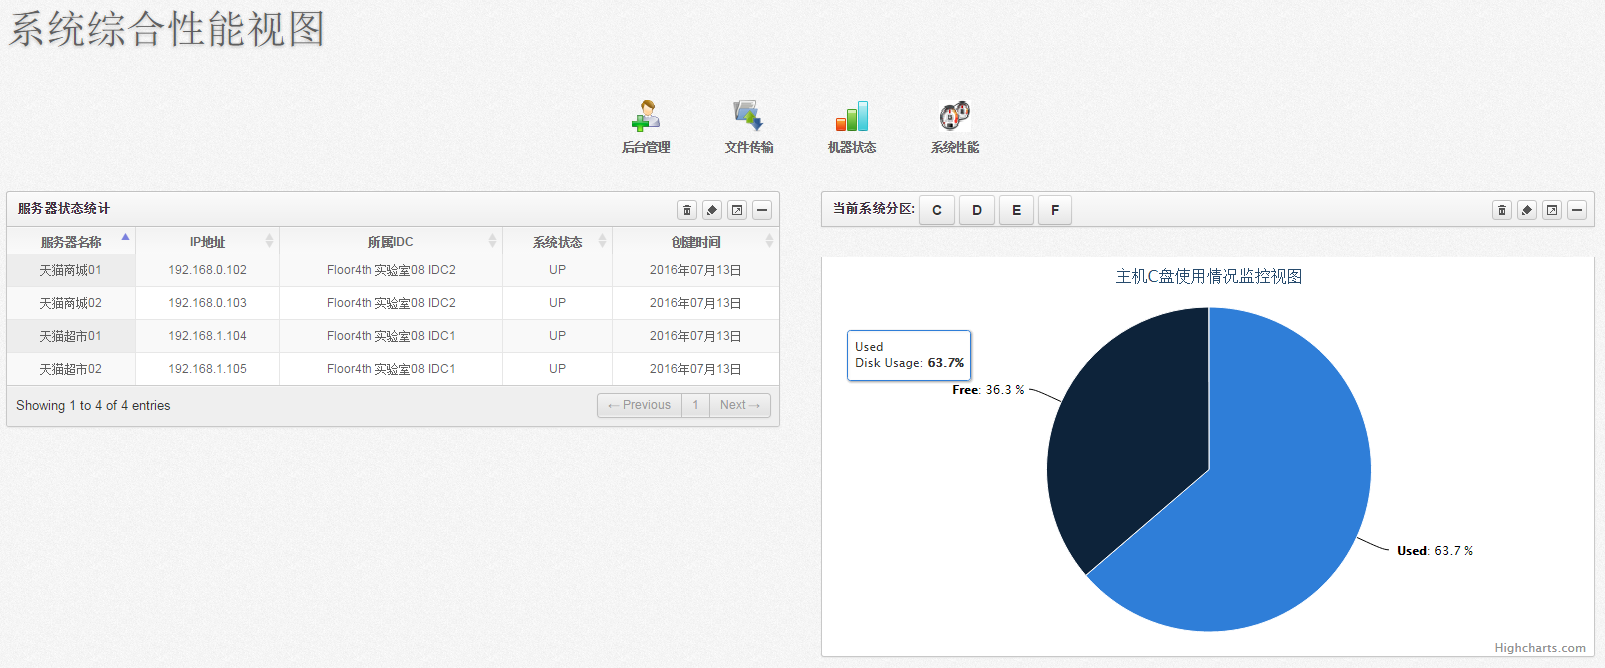
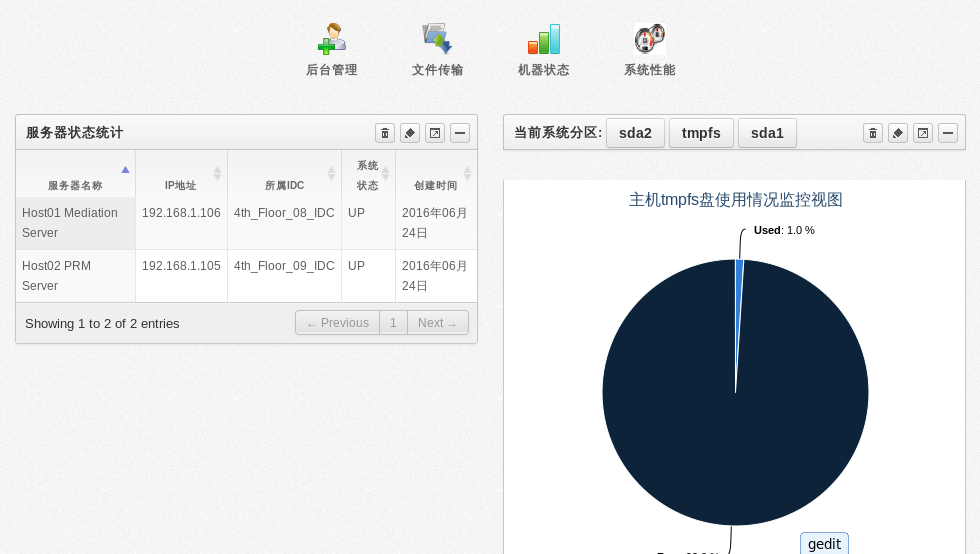
磁盘使用情况监控视图:这一部分首先是使用基于类的通用视图获取监控目标对象的分区信息,展现在页面上,方便监控时进行切换查看。然后使用Jquery以及Ajax来调用后台接口getDiskInfo获取对应盘符的空间占用情况:
前台Jquery与Ajax实现代码:
    var disk_u =0,disk_f =0,disk_name = "";
    $(document).ready(function(){

    $("span.disk_change").click(function(){
        var disk_change = $(this).html();
        console.log(disk_change)
        $.ajax({
                 url:"/getDiskInfo/"+disk_change,
                 async:false,
                 success:function(data){
                              console.log(data)
                              var jsondata= JSON.parse(data);
                              disk_u = jsondata.disk_used;
                              disk_f = jsondata.disk_free;
                              disk_name = jsondata.disk_name;
                         }

                });
    $(function () {
    $('#idget-id-server').highcharts({
        chart: {
            plotBackgroundColor: null,
            plotBorderWidth: null,
            plotShadow: false

        },
        title: {
            text: '主机'+disk_name+'盘使用情况监控视图'
        },
        tooltip: {
            pointFormat: '{series.name}: <b>{point.percentage:.1f}%</b>'
        },
        plotOptions: {
            pie: {
                allowPointSelect: true,
                cursor: 'pointer',
                dataLabels: {
                    enabled: true,
                    color: '#000000',
                    connectorColor: '#000000',
                    format: '<b>{point.name}</b>: {point.percentage:.1f} %'
                }
            }
        },
        series: [{
            type: 'pie',
            name: 'Disk Usage',
            data: [
                ['Used',   disk_u],
                ['Free',   disk_f],
            ]
        }]
    });
});

    });
    $.ajax({
                 url:"/getDiskInfo/{{default_disk}}",
                 async:false,
                 success:function(data){
                              console.log(data)
                              var jsondata= JSON.parse(data);
                              disk_u = jsondata.disk_used;
                              disk_f = jsondata.disk_free;
                              disk_name = jsondata.disk_name;
                         }

                });
    $(function () {
    $('#idget-id-server').highcharts({
        chart: {
            plotBackgroundColor: null,
            plotBorderWidth: null,
            plotShadow: false

        },
        title: {
            text: '主机'+disk_name+'盘使用情况监控视图'
        },
        tooltip: {
            pointFormat: '{series.name}: <b>{point.percentage:.1f}%</b>'
        },
        plotOptions: {
            pie: {
                allowPointSelect: true,
                cursor: 'pointer',
                dataLabels: {
                    enabled: true,
                    color: '#000000',
                    connectorColor: '#000000',
                    format: '<b>{point.name}</b>: {point.percentage:.1f} %'
                }
            }
        },
        series: [{
            type: 'pie',
            name: 'Disk Usage',
            data: [
                ['Used',   disk_u],
                ['Free',   disk_f],
            ]
        }]
    });
});
    });
后台getDiskinfo接口实现代码:
def getDiskInfo(request,disk_name):
    partition_list = []
    device_name = ""
    platform_type = platform.platform()
    if platform_type.startswith("Windows"):
        partition_info = psutil.disk_partitions()
    elif platform_type.startswith("Linux"):
        partition_info = disk_linux_partitions()
    for items in partition_info:
        if platform_type.startswith("Windows"):
            partition_list.append(items.device[:1])
        elif platform_type.startswith("Linux"):
            disk_partition = items.split('/')[-1]
            partition_list.append(disk_partition)
    if platform_type.startswith("Windows"):
        device_name = disk_name + ':\\'
        device_usage = psutil.disk_usage(device_name)
        disk_used = device_usage.percent
        disk_free = 100 - device_usage.percent
    elif platform_type.startswith("Linux"):
        disk_used = disk_usage_linux(disk_name).split('%')[0]
        disk_free = 100 - int(disk_used)
    print 'platform_type',platform_type,partition_info,disk_name
    disk_name = '"' + disk_name + '"'
    return HttpResponse('{"disk_name":%s,"disk_used": %s,"disk_free":%s}' % (disk_name, disk_used, disk_free))
其中因为psutil的disk_usage()方法不兼容Linux系统,查询不出对应盘符的使用率,所以我写了两个插件linux_disk_partitions.py,linux_disk_usage.py用来在Linux主机上获取对应盘符的空间占用信息。
对应代码linux_disk_usage.py:
#econding=utf-8
#! /usr/bin/env python
import os
def disk_usage_linux(disk_name):
    a = os.popen("df -h")
    for i in a:
    if disk_name in i.split()[0]:
        print disk_name,i.split()[4]
        return i.split()[4]

if __name__ == "__main__":
    disk_usage_linux(disk_name)
linux_disk_partitions.py:
#encoding=utf-8
#!/usr/bin/env python
import os

def disk_linux_partitions():
    partition_list = []
    a = os.popen("df -h")
    for i in a:
        partition_list.append(i.split()[0])
        print partition_list[1:]
    return partition_list[1:]

if __name__ == "__main__":
    disk_linux_partitions()
最终实现的效果如下图:
Windows:
Linux:
源码开放,供各位参考:
https://github.com/jimforit/task_learn