0.简介
Ambari作为一款针对大数据平台的运维管理工具,提供了集群的创建,管理,监控,升级等多项功能,目前在业界已经得到广泛使用。
Ambari指标系统( Ambari Metrics System,以下简称AMS)主要负责监控平台各类服务及主机的运行情况,提供各类服务及主机的相关指标,从而达到判断集群健康情况的目的,其重要性不言而喻。
本文是在深入阅读AMS源代码的基础之上,力求能够从监控指标的采集、存储、聚合及指标获取4个层面详细阐述AMS的整个工作机制。
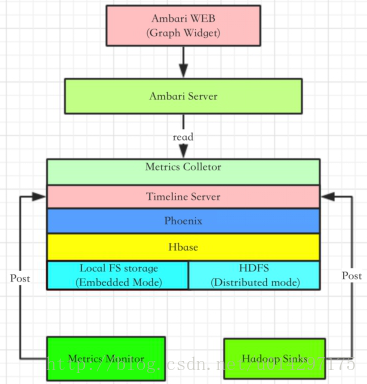
图 1 AMS架构图
1.AMS指标采集
对于 AMS 本身来说,涉及的主要模块有 Metrics Monitor、Hadoop Sinks(此处统称,其中还包含kafka,storm,flume等服务的sinks,严格地来说应叫service sinks) 以及 Metrics Collector。
AMS 也是一个 Master-Slave 结构的框架。Master 模块便是 Metrics Collector,Slave 则是 Metrics Monitor 和 Hadoop Sinks。Slave 模块负责收集信息,并发送给 Collector。
当然 Metrics Monitor 和 Hadoop Sinks 也有不同的职责,前者主要负责收集机器本身相关的指标,例如 CPU、Mem、Disk 相关信息;后者则负责收集 Hadoop 相关 Service 模块的性能数据,例如该模块Namenode占用了多少 Mem,以及该模块的 CPU 占用率等。
1.1 指标收集
关于指标的采集,此处以Flume服务为例,剖析AMS是如何采集Flume运行的相应指标的。Ambari内置了FlumeTimelineMetricsSink这样的jar包,通过Ambari启动flume服务,ambari会在flume的启动脚本参数中加入以下两项:
-Dflume.monitoring.type=org.apache.hadoop.metrics2.sink.flume.FlumeTimelineMetricsSink
-Dflume.monitoring.node=<AMS_HOST>:6188
其中即为AMS collector的节点名字,而6188则是collector中的Timeline Server对外提供的默认端口,以此来向Timeline Server推送数据。
接下来再看一下FlumeTimelineMetricsSink jar包的结构,其中就包含一个FlumeTimelineMetricsSink类,继承自AbstractTimelineMetricsSink抽象类并实现MetricsSink接口,如上所示的所有服务的sink包基本都采用这样的结构。
FlumeTimelineMetricsSink类中内置一个TimelineMetricsCollector线程,在flume启动FlumeTimelineMetricsSink jar包时,其就通过其start方法中的线程调度器来轮询调度TimelineMetricsCollector线程,而在此线程中主段代码如下所示。
@Override
  public void start() {
    LOG.info("Starting Flume Metrics Sink");
    TimelineMetricsCollector timelineMetricsCollector = new TimelineMetricsCollector();
    if (scheduledExecutorService == null || scheduledExecutorService.isShutdown() || scheduledExecutorService.isTerminated()) {
      scheduledExecutorService = Executors.newSingleThreadScheduledExecutor();
    }
    scheduledExecutorService.scheduleWithFixedDelay(timelineMetricsCollector, 0,
        pollFrequency, TimeUnit.MILLISECONDS);
  }  }
从上面可看出Start方法中采取线程池的方法,以pollFrequency(可配置)的周期间隔,调度TimelineMetricsCollector线程,再细看一下TimelineMetricsCollector线程的详细说明,其主要代码如下所示。
class TimelineMetricsCollector implements Runnable {
    @Override
    public void run() {
      try {
        Map<String, Map<String, String>> metricsMap = JMXPollUtil.getAllMBeans();
        long currentTimeMillis = System.currentTimeMillis();
        for (String component : metricsMap.keySet()) {
          Map<String, String> attributeMap = metricsMap.get(component);
          LOG.debug("Attributes for component " + component);
          processComponentAttributes(currentTimeMillis, component, attributeMap);
        }
      }
TimelineMetricsCollector线程轮循从服务的JMX端口中获取指标数据,形成Map对象,并通过processComponentAttributes方法进行逻辑转换后再发送。
1.2 指标推送
由上面源码可以看出,本质上,AMS的监控数据还是从各服务JMX端口中取得的,再通过processComponentAttributes方法逻辑上转换成AMS的内部的TimelineMetrics,通过emitMetrics方法post到Timeline Server(emitMetrics方法正是从AbstractTimelineMetricsSink类继承而来),其接口为:
http://:6188/ws/v1/timeline/metrics
如下是emitMetrics方法的部分片段,从中可以看出,emit方法最终还是将指标数据转化成json格式的数据,通过接口推送至TimelineServer。
protected void emitMetrics(TimelineMetrics metrics) throws IOException {
    String connectUrl = getCollectorUri();
    try {
      String jsonData = mapper.writeValueAsString(metrics);
      StringRequestEntity requestEntity = new StringRequestEntity(jsonData, "application/json", "UTF-8");
      PostMethod postMethod = new PostMethod(connectUrl);
      postMethod.setRequestEntity(requestEntity);
      int statusCode = httpClient.executeMethod(postMethod);
若是转换成curl命令的形式,则通过以下这样一条命令进行推送数据:
curl -i -X POST -H "Content-Type: application/json" -d "${json}" ${url}
其中json为转化成json的metrics数据,url为上面接口。
emitMetrics方法或curl命令发送的url最终会被Timeline server所截获,再通过TimelineMetricStore类以phonenix接口方式存储到hbase数据库中,如下文TimelineWebServices类代码所示。
@Path("/metrics")
@POST
@Consumes({ MediaType.APPLICATION_JSON /* , MediaType.APPLICATION_XML */})
  public TimelinePutResponse postMetrics(
    @Context HttpServletRequest req,
    @Context HttpServletResponse res,
    TimelineMetrics metrics) {
    init(res);
    if (metrics == null) {
      return new TimelinePutResponse();
    }
    try {
      // TODO: Check ACLs for MetricEntity using the TimelineACLManager.
      // TODO: Save owner of the MetricEntity.
      return timelineMetricStore.putMetrics(metrics);
}
上文描述了Flume服务指标推送的大概过程,服务运行时主动推送指标, AMS接收推送指标。其它各类服务如hadoop,kafka,storm均以此种方式进行指标的推送,在此不再作详细讨论。
2.AMS指标存储
AMS采集到的服务指标通过http/https的方式推送到timeline server,timeline server内部嵌入了一个hbase,通过phoenix(nosql之上的sql查询)将指标数据存入到hbase中。
Hbase库中总共有7张表,其相应表名如下表所示。
表2-1 Metrics指标存储表
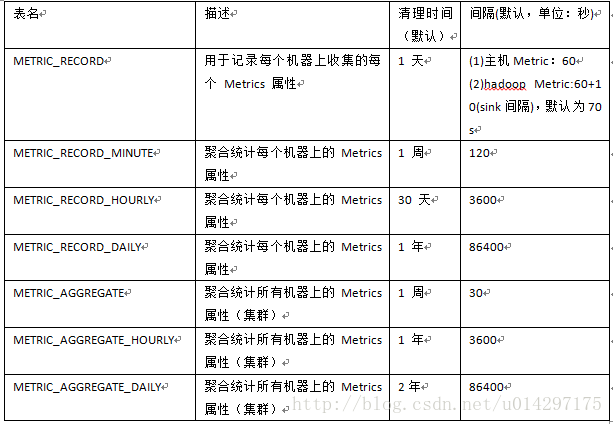
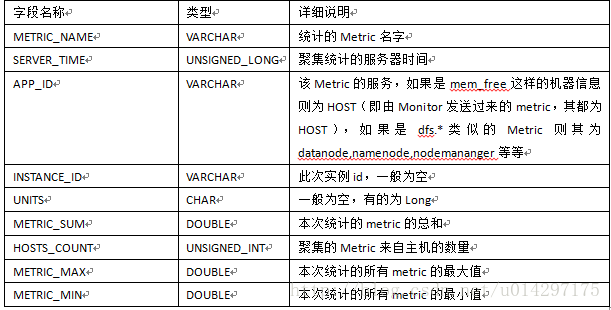
虽然库中一共有7张表,但是实际存储指标数据的只有METRIC_RECORD表,其它各表是在其基础之上做相应的统计及聚合而成的,下表是METRIC_RECORD表详细说明。
表2-2 METRIC_RECORD表字段说明
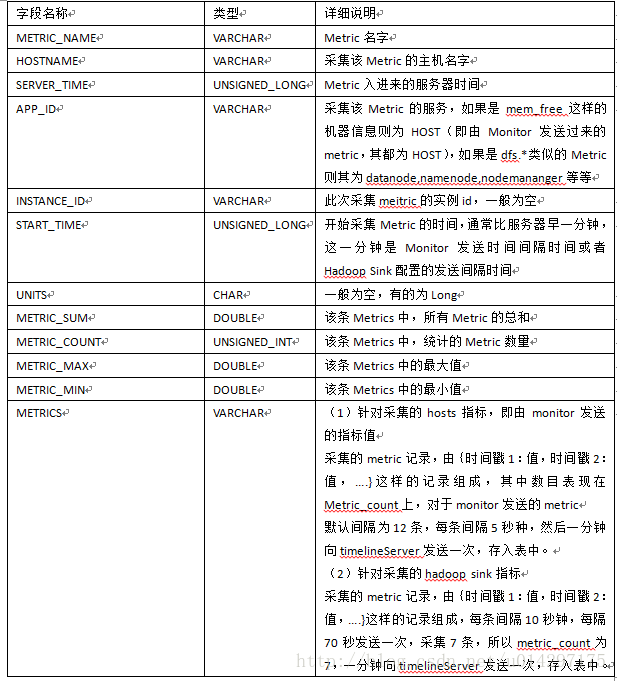
该表是所有表中唯一存储实际metrics数据的表,其它表都是在此表的基础之上进行时间段的相应统计。
(1)针对采集的hosts指标,即由monitor发送的指标值
采集的metric记录,由{时间戳1:值,时间戳2:值,….}这样的记录组成,其中数目表现在Metric_count上,对于monitor发送的metric。为12条,每条间隔5秒种,然后一分钟向timelineServer发送一次,存入表中。
(2)针对采集的hadoop sink指标
采集的metric记录,由{时间戳1:值,时间戳2:值,….}这样的记录组成,每条间隔10秒钟,每隔70秒发送一次,采集7条,所以metric_count为7,一分钟向timelineServer发送一次,存入表中。
表METRIC_RECORD_MINUTE是按分钟进行统计的,默认一次统计时间是5min(可配置),该表实则是以METRIC_RECORD表的数据作为统计的基准。下表对METRIC_RECORD_MINUTE做了详细说明。
表2-3 METRIC_RECORD_MINUTE字段说明
假设5分钟统计一次,以mem_free为例,则本次统计是以主机为单位,假设在metric_record表中,某主机每隔一分钟发送一条mem_free的Record,一条record中有12条metric values,则本次统计共有5条Record,metric_count则为60条。同样的,这五分钟内的最大,最小和总和,只需要比对提取Metric_record中这60条的Record的最大,最小,以及5条总和即能统计出这5分钟内相应的属性。
类似于这样几条语句得以统计:
    (1)select hostname,max(metric_max) from metric_record where metric_name='mem_free' and server_time>=1471503845324 and server_time<1471504146520 group by hostname;------统计5分钟内,每台主机上该metric的最大值。
  (2)select hostname,min(metric_min) from metric_record where metric_name='mem_free' and server_time>=1471503845324 and server_time<1471504146520 group by hostname; ------统计5分钟内,每台主机上该metric的最小值。
  (3)select hostname,sum(metric_sum) from metric_record where metric_name='mem_free' and server_time>=1471503845324 and server_time<1471504146520 group by hostname; ------统计5分钟内,每台主机上该metric值总和。
  (4)select hostname,sum(metric_count) from metric_record where metric_name='mem_free' and server_time>=1471503845324 and server_time<1471504146520 group by hostname; ------统计5分钟内,每台主机上统计的该metric数量和。
至于METRIC_RECORD_HOURLY以及METRIC_RECORD_DAILY表其原理均是参照MINUTE表的原理,只是时间区间扩大了,已经参照的数据表变更了,METRIC_RECORD_HOURLY以METRIC_RECORD_MINUTE的数据为基准,而METRIC_RECORD_DAILY则以METRIC_RECORD_HOURLY的数据为基准进行统计,在此就不再描述了。
3.AMS指标聚集
上文中所统计的7张表,除了以METRIC_RECORD前缀的表之外,还有METRIC_AGGREGATE作为前缀的表,这就是集群的指标聚集表,在聚集表中不区分host,只是以service(APP_ID)
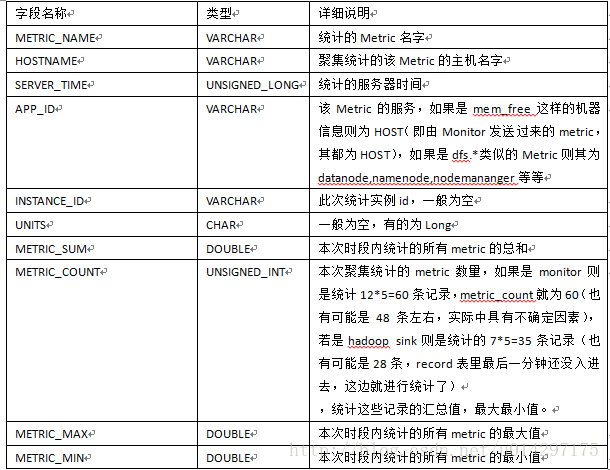
进行分组统计,其数据来源也是从METRIC_RECORD表中进行查询后然后再进行聚集的,下表是表字段的详细说明。
表3-1 METRIC_AGGREGATE表字段详细说明
以Metric_Name为主要指标,由于是集群级别的统计,所以不再有HOSTNAME相关字段的说明,在此表中增加了HOSTS_COUNT的字段,即聚集的Metric来自主机的数量。
实际中不存在表METRIC_AGGREGATE_MINUTE,但是在图3-1中可以看到一个单独的TimelineMetricClusterAggregatorMinute聚集线程类,每2分钟聚集一次,其聚集结果采取了分片的方式,30秒一个片区记录,即0-30秒,30-60秒,60-90秒,90-120秒分成4个片区,每个时间段采集的记录分别存到对应的片区记录中,而各个片区记录直接存入到METRIC_AGGREGATE表中,该表间隔记录为30秒一条,是在表METRIC_AGGREGATE_MINUTE的基础之上进行分片的,之所以这么设定,也是为了防止频繁的聚集对AMS造成过大负载。
这个分片时间是由参数timeline.metrics.cluster.aggregator.minute.timeslice.interval进行设定的,所以METRIC_AGGREGATE表其实是METRIC_AGGREGATE_MINUTE表聚合统计的结果之上,再对其结果按时间进行分片而形成的。
指标聚集由TimelineMetricAggregator起始,其作为一个接口,也是一个线程,其实现子类如下图所示。
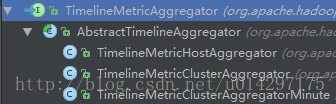
图3-1 TimelineMetricAggregator层次图
在AbstractTimelineAggregator类中实现了run方法,其中通过轮循调度doWork方法来实现聚集,调度时间可配置,如下是doWork程序代码。
@Override
  public boolean doWork(long startTime, long endTime) {
    boolean success = true;
    Condition condition = prepareMetricQueryCondition(startTime, endTime);
    Connection conn = null;
    PreparedStatement stmt = null;
    ResultSet rs = null;
    try {
      conn = hBaseAccessor.getConnection();
      stmt = PhoenixTransactSQL.prepareGetMetricsSqlStmt(conn, condition);
      if (condition.doUpdate()) {
        int rows = stmt.executeUpdate();
        conn.commit();
      } else {
        rs = stmt.executeQuery();
      }
      aggregate(rs, startTime, endTime);
      }
通过以上代码可以看到,在doWork方法中,首先还是通过phoenix接口查询到数据集,再对数据集进行聚集(aggregate方法中),针对不同的AbstractTimelineAggregator的子类,具有不同的aggregate方法,最终存入到METRIC_AGGREGATE表中,如此实现整个AMS的指标聚集功能。
4.AMS指标获取
AMS提供了2种获取指标的接口,分别是Collector提供的API以及Ambari Server的API接口。其中前一种方式更接近原生的指标数据,而后一种方式更为常用,应该说整个Ambari上层获取指标的方式都是采取后者,而后者在底层本质上还是调用的第一种方式,拿到库中的原生数据,再进行加工及逻辑处理,最后返回到WEB端。
4.1 Collector API
http://<AMS_HOST>:6188/ws/v1/timeline/metrics?metricNames=<>&hostname=<>&appId=<>&startTime=<>&endTime=<>&precision=<>
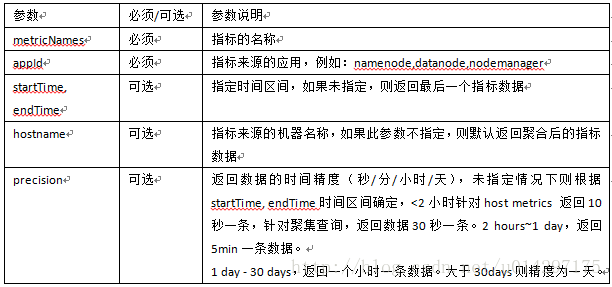
如上是AMS Collector的总体API,其参数说明如下表所示。
表4-1 Collector API参数说明
当以此接口获取指标数据时,首先此URL会被TimelineWebServices捕获到,其类中相应代码如下所示。
@GET
@Path("/metrics")
@Produces({ MediaType.APPLICATION_JSON })
  public TimelineMetrics getTimelineMetrics(
    @Context HttpServletRequest req,
    @Context HttpServletResponse res,
    @QueryParam("metricNames") String metricNames,
    @QueryParam("appId") String appId,
    @QueryParam("instanceId") String instanceId,
    @QueryParam("hostname") String hostname,
    @QueryParam("startTime") String startTime,
    @QueryParam("endTime") String endTime,
    @QueryParam("precision") String precision,
    @QueryParam("limit") String limit,
    @QueryParam("grouped") String grouped,
    @QueryParam("topN") String topN,
    @QueryParam("topNFunction") String topNFunction,
    @QueryParam("isBottomN") String isBottomN,
    @QueryParam("seriesAggregateFunction") String seriesAggregateFunction
 ) {
    init(res);
    try {
      return timelineMetricStore.getTimelineMetrics(
        parseListStr(metricNames, ","), parseListStr(hostname, ","), appId, instanceId,
        parseLongStr(startTime), parseLongStr(endTime),
        Precision.getPrecision(precision), parseIntStr(limit),
        parseBoolean(grouped), parseTopNConfig(topN, topNFunction, isBottomN),
        seriesAggregateFunction);
}
如上代码所示,在Timeline server捕获到请求后,会调用TimelineMetricStore.getTimelineMetrics方法,并传入相应的请求参数,获取指标数据。再深入到TimelineMetricStore中可以看到此类为一个接口,唯一的实现子类为HBaseTimelineMetricStore,通过其getTimelineMetrics方法取得指标数据,其主要代码如下所示。
@Override
  public TimelineMetrics getTimelineMetrics(List<String> metricNames,
      List<String> hostnames, String applicationId, String instanceId,
      Long startTime, Long endTime, Precision precision, Integer limit,
      boolean groupedByHosts, TopNConfig topNConfig, String seriesAggregateFunction) throws SQLException, IOException {
    TimelineMetricsSeriesAggregateFunction seriesAggrFunctionInstance = null;
    ……………………………………….
    Multimap<String, List<Function>> metricFunctions =
      parseMetricNamesToAggregationFunctions(metricNames);
    ConditionBuilder conditionBuilder = new ConditionBuilder(new ArrayList<String>(metricFunctions.keySet()))
      .hostnames(hostnames)
      .appId(applicationId)
      .instanceId(instanceId)
      .startTime(startTime)
      .endTime(endTime)
      .precision(precision)
      .limit(limit)
      .grouped(groupedByHosts);
………………………………………….
………………………………………
    Condition condition = conditionBuilder.build();
    TimelineMetrics metrics;
    if (hostnames == null || hostnames.isEmpty()) {
      metrics = hBaseAccessor.getAggregateMetricRecords(condition, metricFunctions);
    } else {
      metrics = hBaseAccessor.getMetricRecords(condition, metricFunctions);
    }
    metrics = postProcessMetrics(metrics);
    ………………………………..
    return seriesAggregateMetrics(seriesAggrFunctionInstance, metrics);
  }
从上文代码中也可以看出,HBaseTimelineMetricStore类在其内部通过注解映射查询的条件构建用于查询的Condition对象,其次向HBaseAccessor传入此条件用于查询,根据查询参数中是否有无hostname从而决定是查询聚集表还是主机表,最终取得相应的查询结果,其中代码在此不再详述,感兴趣可以自行阅读,至此,通过Collector API取得指标数据的流程就打通了。
4.2 Ambari Server API
Ambari Server API总体上分为3个层次,具有3种类型的API,无论是哪种类型的API,在其底层取数据时,最终都是利用Collector的API,如下是整体的架构详细图。
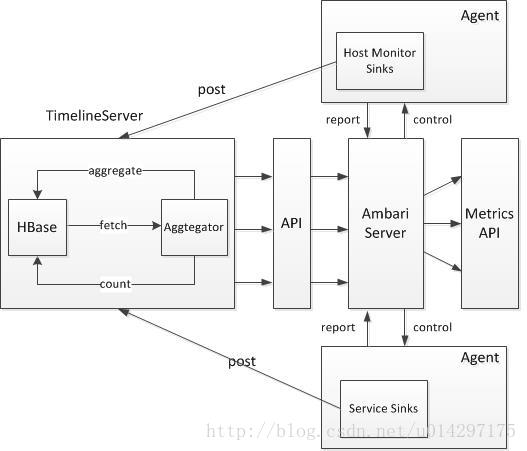
图4-1 AMS工作机制图
4.2.1 主机类型指标API
http://<ambari-server>:8080/api/v1/clusters/<cluster-name>/hosts/<host-name>?fields=metrics/cpu/cpu_user[1430844610,1430848210,15]
此API是主机类型的API,在其中具有/hosts/的前缀和参数的补充,fileds后面跟的是指标名称,[]内描述的是时间起始。上文中说过,Server的API在其底层还是调用Collector的API,那么此API在其对应的底层便是Collector的API加上hostname及appId可选参数,其中appId设为HOST即可,其后的时间戳便是在startTime和endTime中描述。
4.2.2 组件类型指标API
http://<ambari-server>:8080/api/v1/clusters/<cluster-name>/services/HDFS/components/DATANODE?fields=metrics/dfs/datanode/DfsUsed[1430844610,1430848210,15]
组件类型的API取消了hostname的参数,其主要针对服务整体的聚集查询,其所查询的表也是METRIC_AGGREGATE类型的表,对应于Collector的API则是在其中取消了hostname的参数字段,则API默认去聚集表(METRIC_AGGREGATE)中查询。
4.2.3 主机组件类型指标API
http://<ambari-server>:8080/api/v1/clusters/<cluster-name>/hosts/<host-name>/host_components/NAMENODE?fields=metrics/jvm/memHeapCommittedM[1430847303,1430850903,15]- 1
主机组件类型的API实则和主机类型的API类似,只是主机类型直接是针对主机相关指标如cpu,mem类型的指标的获取,而主机组件则是真多host之上的部署的服务的指标的获取,所以在其API中新增了host_components参数。对应于底层Collector的API,只需要将主机类型对应的Collector的API中的appId由HOST替换成相应的服务名称即可。
以上3种类型的API,无论哪一种,在其底层最终都是调用Collector API取得metric数据的,主机类型指标则是在Collector API中补充上hostname属性,组件指标则是在Collector API去掉hostname属性,让其做聚集查询(去METRIC_AGGREGATE查询数据),而主机组件指标类型则是同时补充上appId与hostname两个参数进行查询,下图描述了通过Server API获取metric数据时主要实现类及其继承结构。
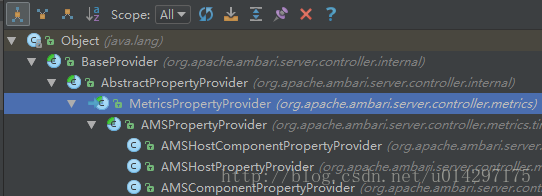
图 4-2 AMSPropertyProvider类层次图
当向Server发送Metric的请求URL时,最终都会在Server端通过AMSPropertyProvider转化成一个MetricRequest,MetricRequest是AMSPropertyProvider的内部类,再由MetricRequest.populateResources方法进行请求的处理,下文是其主要核心代码。
public Collection<Resource> populateResources() throws SystemException {
if (!hostComponentHostMetrics.isEmpty()) {
        String hostComponentHostMetricParams = getSetString(processRegexps(hostComponentHostMetrics), -1);
         setQueryParams(hostComponentHostMetricParams, hostnames, true, componentName);
          TimelineMetrics metricsResponse = null;
          try {
            metricsResponse = getTimelineMetricsFromCache(
              getTimelineAppMetricCacheKey(hostComponentHostMetrics,
                componentName, uriBuilder.toString(),hostnames), componentName);
          }
此方法首先针对metric的请求类型做了判断,针对不同的指标分别进行不同的处理。此处便是hostComponentHostMetrics散列表不为空的情况下(即此为主机指标的请求),针对此请求,首先利用setQueryParams查询参数设置,其次执行getTimelineMetricsFromCache取得返回的metrics,在其中传入了uriBuilder,此对象即为Collector的API,构建完成之后即通过此URL取得相应的metrics数据。
接下来直接进入getTimelineMetricsFromCache方法,其代码如下所示。
private TimelineMetrics getTimelineMetricsFromCache(TimelineAppMetricCacheKey metricCacheKey,String componentName) throws IOException {
      // Cache only the component level metrics
      // No point in time metrics are cached
      if (metricCache != null
          && !StringUtils.isEmpty(componentName)
          && !componentName.equalsIgnoreCase("HOST")
          && metricCacheKey.getTemporalInfo() != null) {
        return metricCache.getAppTimelineMetricsFromCache(metricCacheKey);
      }
      return requestHelper.fetchTimelineMetrics(metricCacheKey.getSpec());
    }
从代码中看到,其针对有无AMS缓存的情况分别进行了处理,在原始无缓存的情况下,则是通过requestHelper.fetchTimelineMetrics的方法取得相应的metric数据,而传入的参数实则就是上文的URL。
紧接着进入fetchTimelineMetrics方法,从下文代码可以看到,最终是通过streamProvider.readFrom(spec)此方法取得metrics数据的,而streamProvider则是一个封装好的URL读取数据对象。
public TimelineMetrics fetchTimelineMetrics(String spec) throws IOException {
    LOG.debug("Metrics request url = " + spec);
    BufferedReader reader = null;
    TimelineMetrics timelineMetrics = null;
    try {
      reader = new BufferedReader(new InputStreamReader(streamProvider.readFrom(spec)));
      timelineMetrics = timelineObjectReader.readValue(reader);
}
5.总结
本文主要是从AMS指标的采集、存储、聚集、获取四个层面,详细描述了AMS整个内在工作机制,并详细整理了AMS对外各API不同点及其来龙去脉。由于源码的复杂性,本文只罗列相关的主要功能代码及其相应的流程,并未细化到最底层的实现,不足之处,敬请见谅。同时,也期待您的指导与帮助。
参考资料:
1.http://www.ibm.com/developerworks/cn/opensource/os-cn-ambari-metrics/index.html
2.http://blog.csdn.net/bluishglc/article/details/48155265