1.安装及配置Kibana
cd /usr/local/src
yum -y install kibana-5.4.0-x86_64.rpm
grep "^[a-Z]" /etc/kibana/kibana.yml
server.port: 5601
server.host: "10.0.0.22"
elasticsearch.url: "http://10.0.0.22:9200"

systemctl enable kibana
systemctl start kibana
# 浏览器访问10.0.0.22:5601,通过http://10.0.0.22:5601/status来查看是否正常
2.通过配置logstash文件收集message日志
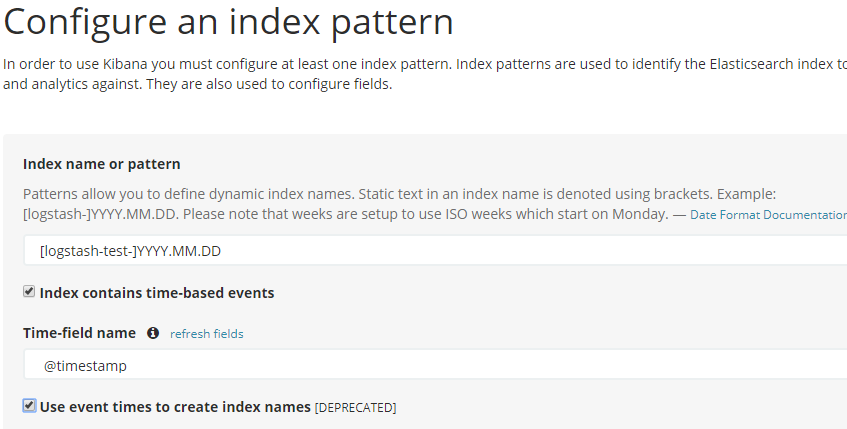
在Kibana上展示上一节收集的日志信息,添加索引
使用logstash配置文件收集messages日志
vim /etc/logstash/conf.d/system.conf
input {
  file {
    path => "/var/log/messages"
    type => "systemlog"
    start_position => "beginning"
    stat_interval => "2"
  }
}

output {
  elasticsearch {
    hosts => ["10.0.0.22:9200"]
    index => "logstash-systemlog-%{+YYYY.MM.dd}"
  }
}
path => "/var/log/messages":要收集的文件路径
start_position => "beginning":从什么位置开始读取文件数据,默认是结束位置,会以类似 tail -F 的形式运行.
如果你是要导入原有数据,把这个设定改成"beginning",logstash 进程就从头开始读取,类似 less +F 的形式运行.
stat_interval => "2":每隔多久检查一次
/usr/share/logstash/bin/logstash -f /etc/logstash/conf.d/system.conf -t # 检测配置文件是否有语法错误
ll /var/log/messages  # logstash是普通用户,想要对系统日志有读权限,就得改文件权限
chmod 644 /var/log/messages
systemctl restart logstash
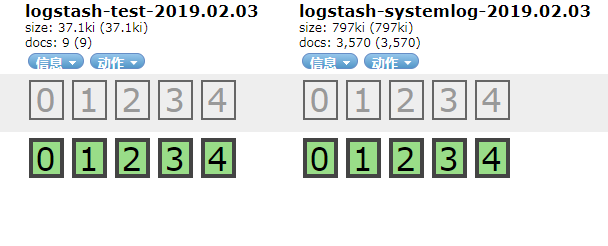
在管理界面查看是否有相应的索引
添加到Kibana中展示,创建索引

3.使用一个配置文件收集多个日志(这个配置文件是后来改过的)
cat /etc/logstash/conf.d/colectTwo.conf
input {
  file {
        path => "/var/log/nginx/access.log"
        type => "nginx-access"
        start_position => "beginning"
        stat_interval => "2"
  }
  file {
        path => "/var/log/nginx/error.log"
        type => "nginx-error"
        start_position => "beginning"
        stat_interval => "2"
  }
  file {
        path => "/var/log/mysql.log"
        type => "mysql-log"
        start_position => "beginning"
        stat_interval => "2"
  }
}

output {
  if [type] == "nginx-access" {
  elasticsearch {
        hosts => ["10.0.0.22:9200"]
        index => "logstash-nginx-access-%{+YYYY.MM.dd}"
  }
}

  if [type] == "nginx-error" {
  elasticsearch {
        hosts => ["10.0.0.22:9200"]
        index => "logstash-nginx-error-%{+YYYY.MM.dd}"
  }
}
  if [type] == "mysql-log" {
  elasticsearch {
        hosts => ["10.0.0.22:9200"]
        index => "logstash-mysql-log-%{+YYYY.MM.dd}"
  }
}
}
配置文件检测语法是否正常:
/usr/share/logstash/bin/logstash -f /etc/logstash/conf.d/colectTwo.conf -t
systemctl restart logstash
echo qweqweqweasdqwedqwe > /var/log/mysql.log
chmod 666 /var/log/mysql.log
usermod -G adm logstash
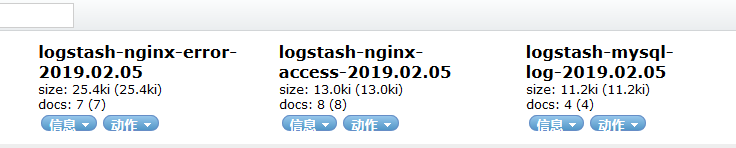
通过head插件查看
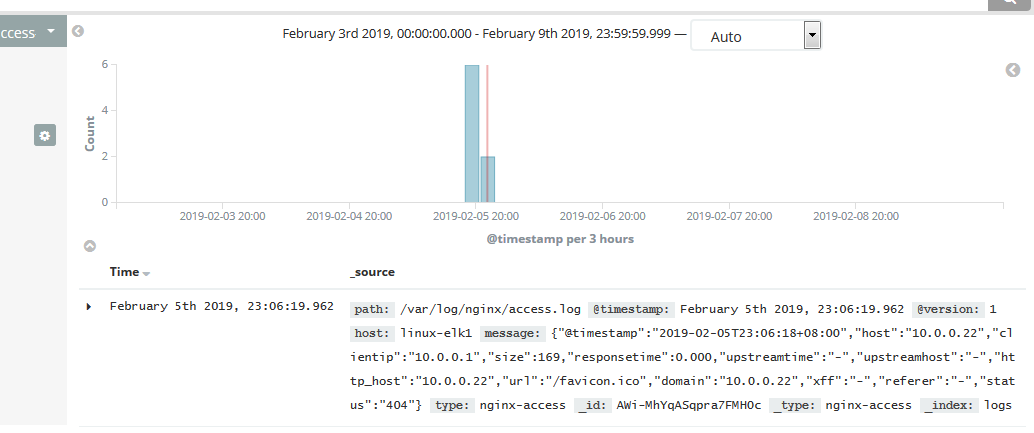
Kibana创建索引[logstash-nginx-access-]YYYY.MM.DD:
Kibana部署及message日志收集:http://blog.51cto.com/jinlong/2055042