1.监控关键业务链接的状态(是否返回200,响应时间等等)
这在prometheus上已经提供了现成的exporter,可以参考
https://github.com/prometheus/blackbox_exporter
具体使用和效果这里还有一个博客
https://medium.com/the-telegraph-engineering/how-prometheus-and-the-blackbox-exporter-makes-monitoring-microservice-endpoints-easy-and-free-of-a986078912ee
2.监控具体的业务指标
以tomcat为例,创建一个metrics的应用,然后里面加入一个index.jsp文件,将需要暴露的指标都写到这个文件中
比如
[root@master metrics]# cat index.jsp
# HELP helloworld_ordernumber Number of Order.
# TYPE helloworld_ordernumber gauge
helloworld_ordernumber 10
# HELP helloworld_orderamount Amount of Order.
# TYPE helloworld_orderamount gauge
helloworld_orderamount 100
说明如下:
- 整个是text格式,不需要加html,body什么的
- 每个自定义指标前面加上HELP和TYPE, gauge类型意思是可大可小,而不是累加的counter类型。
- 这个具体指标的获取以后可以设计成通过调用程序接口或者访问数据库的模式,这里为了简化写死。
修改prometheus的配置文件
加入被监控的target
[root@master prometheus-2.7.1.linux-amd64]# cat prometheus.yml
# my global config
global:
  scrape_interval:     15s # Set the scrape interval to every 15 seconds. Default is every 1 minute.
  evaluation_interval: 15s # Evaluate rules every 15 seconds. The default is every 1 minute.
  # scrape_timeout is set to the global default (10s).

# Alertmanager configuration
alerting:
  alertmanagers:
  - static_configs:
    - targets:
      # - alertmanager:9093

# Load rules once and periodically evaluate them according to the global 'evaluation_interval'.
rule_files:
  # - "first_rules.yml"
  # - "second_rules.yml"

# A scrape configuration containing exactly one endpoint to scrape:
# Here it's Prometheus itself.
scrape_configs:
  # The job name is added as a label `job=<job_name>` to any timeseries scraped from this config.
  - job_name: 'prometheus'

    # metrics_path defaults to '/metrics'
    # scheme defaults to 'http'.

    static_configs:
    - targets: ['localhost:9100']
    - targets: ['localhost:8080']
启动,然后打开http://192.168.56.108:9090/targets
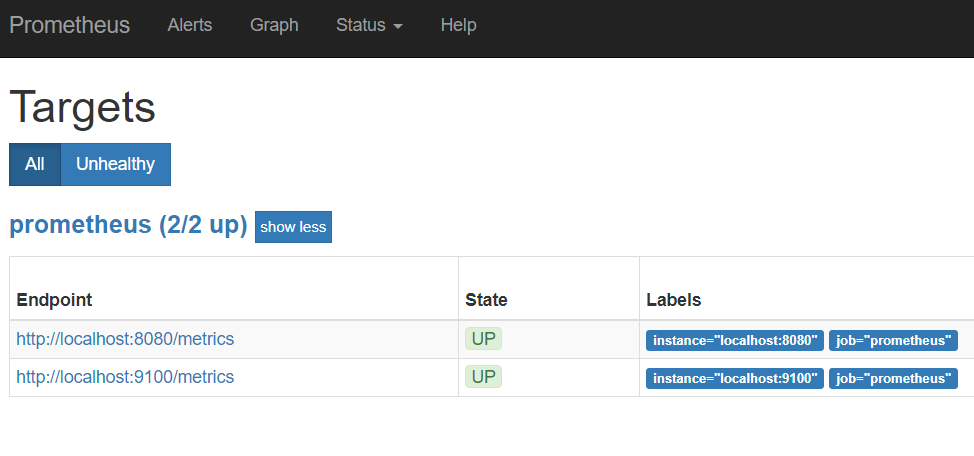
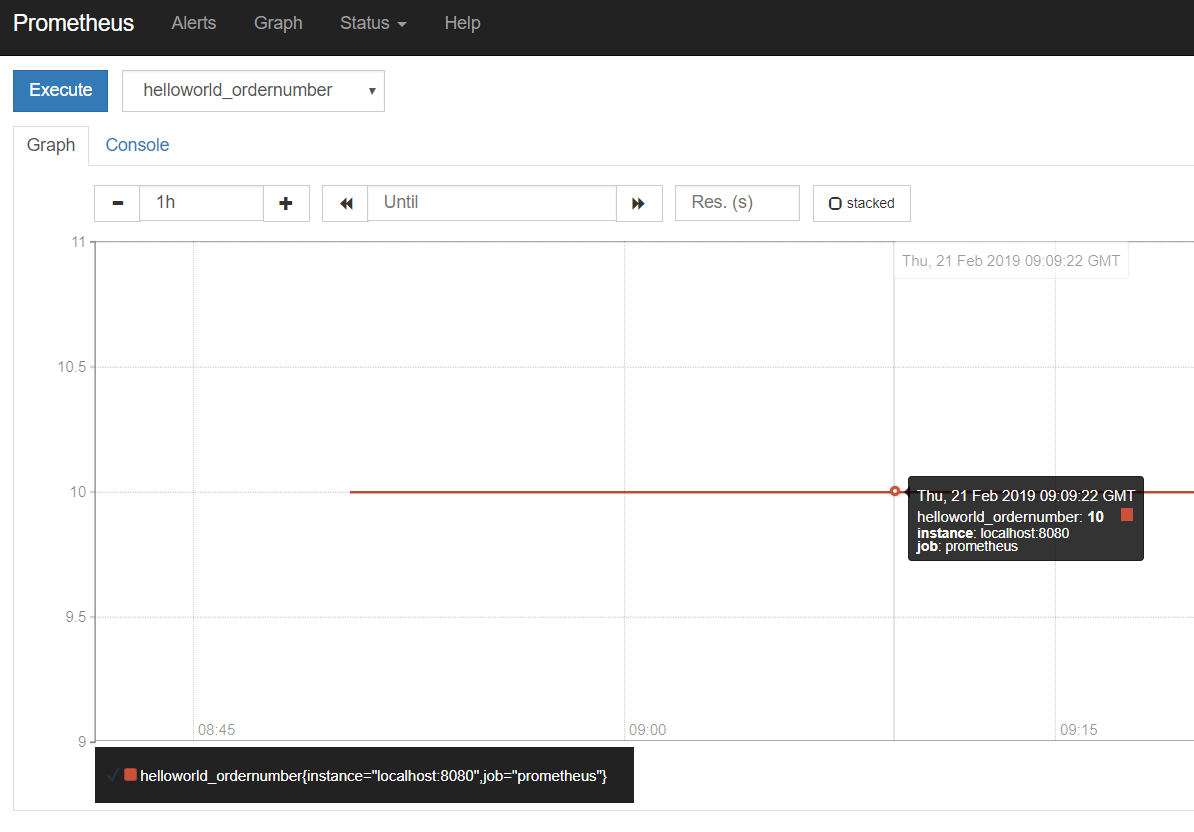
获取和访问指标
3.在OpenShift容器云环境下的监控
- index.jsp或者类似的metrics,和业务应用绑定在一起,因此和业务是一个Pod
- 如果需要针对每个微服务暴露的业务指标进行监控,需要在Openshift容器内部部署Prometheus.
- 如果是在集群外部署Prometheus,需要把需要监控的服务通过route暴露出来
4. 监控类别及方式说明
- 业务监控实际上是获取业务的指标,比如存放在redis或者数据库,如果存在多个应用实例,只需要走任意一个实例访问获取即可。
- 如果是监控每个实例是否正常工作,可以通过OpenShift提供的readness Probe和liveness Probe.由Kubernetes来保障