一、哪些DLL能够生成PPT
2、Microsoft.Office.Interop.PowerPoint
简单区别:Spire.Presentation分收费版和免费版(最多创建10张幻灯片)
Microsoft.Office.Interop.PowerPoint是免费的
二、用Spire.Presentation实现创建PPT
1、vs创建控制台应用程序
2、添加引用Spire.Presentation

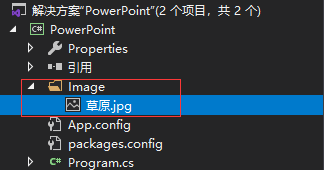
3、创建Image文件夹放入图片
4、实现代码
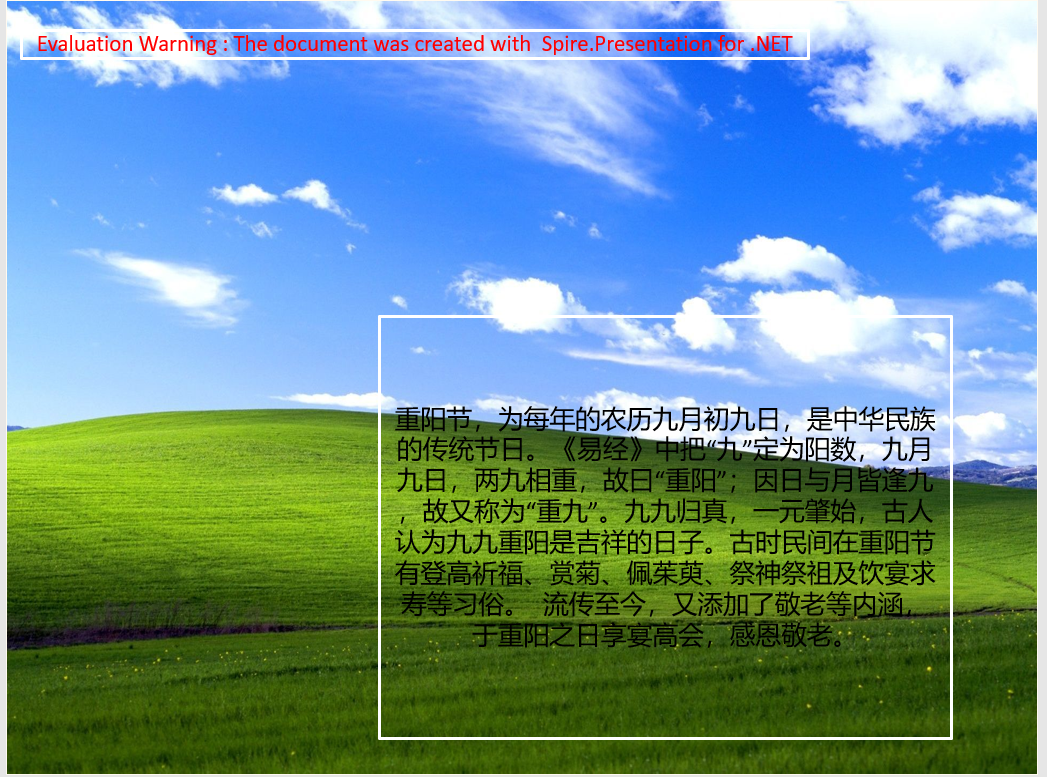
 //创建Presentation对象
            Presentation presentation = new Presentation();
            //加载图片作为幻灯片背景
            string dir = AppDomain.CurrentDomain.BaseDirectory;
            dir = Path.GetFullPath("../..") + "\Image";
            string ImageFile = dir + "\草原.jpg";
            RectangleF rect = new RectangleF(0,0,presentation.SlideSize.Size.Width,presentation.SlideSize.Size.Height);
            presentation.Slides[0].Shapes.AppendEmbedImage(ShapeType.Rectangle, ImageFile, rect);
            presentation.Slides[0].Shapes[0].Line.FillFormat.SolidFillColor.Color = Color.FloralWhite;

            //获取第一张幻灯片,添加指定大小的shape到页面指定位置
            IAutoShape shape = presentation.Slides[0].Shapes.AppendShape(ShapeType.Rectangle, new RectangleF(260, 220, 400, 295));
            //设置shape的边框颜色
            shape.ShapeStyle.LineColor.Color = Color.White;
            //设置shape填充效果及颜色
            shape.Fill.FillType = Spire.Presentation.Drawing.FillFormatType.None;
            //添加文本到shape,并设置文字填充效果、颜色
            shape.AppendTextFrame("重阳节,为每年的农历九月初九日,是中华民族的传统节日。"
                + "《易经》中把“九”定为阳数,九月九日,两九相重,故曰“重阳”;"
                + "因日与月皆逢九,故又称为“重九”。"
                + "九九归真,一元肇始,古人认为九九重阳是吉祥的日子。"
                + "古时民间在重阳节有登高祈福、赏菊、佩茱萸、祭神祭祖及饮宴求寿等习俗。 "
                + "流传至今,又添加了敬老等内涵,于重阳之日享宴高会,感恩敬老。");
            TextRange textRange = shape.TextFrame.TextRange; textRange.Fill.FillType = Spire.Presentation.Drawing.FillFormatType.Solid; textRange.Fill.SolidColor.Color = Color.Black;  //设置文本字号、下划线、字体  textRange.FontHeight = 21;  textRange.IsItalic = TriState.False;  textRange.TextUnderlineType = TextUnderlineType.Single;  textRange.LatinFont = new TextFont("Gulim");

            //保存文档
            presentation.SaveToFile("text.pptx", FileFormat.Pptx2010);

            Console.WriteLine("创建成功!");
            Console.ReadKey();
5、效果展示
三、用Microsoft.Office.Interop.PowerPoint实现创建PPT
1、vs创建控制台应用程序
2、添加引用Spire.Presentation
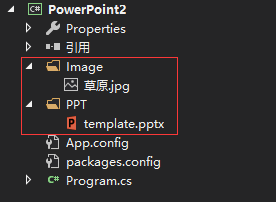
3、添加一个template.pptx空模板
4、实现代码
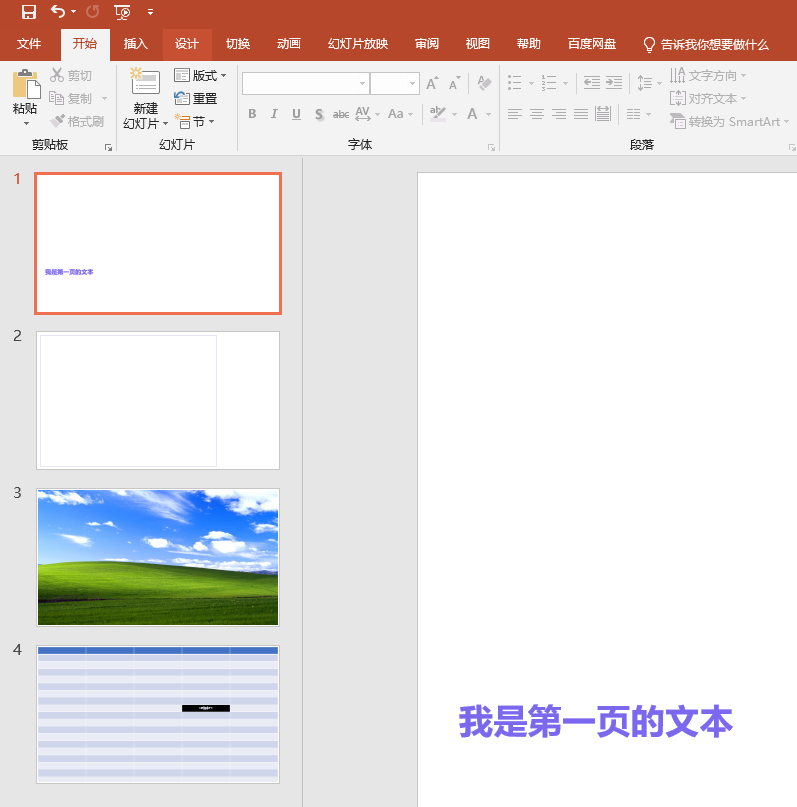
 public class PowerPointHelper
    {
        public static void ReplacePowerPoint()
        {
            string dir = AppDomain.CurrentDomain.BaseDirectory;
            dir = Path.GetFullPath("../..") + "\ppt";
            string filePath = dir + "\template.pptx";

            Application PPT = new Application();//创建PPT应用
            Presentation MyPres = null;//PPT应用的实例

            //PPT中的幻灯片
            Slide MySlide = null;
            Slide MySlide2 = null;
            Slide MySlide3 = null;
            Slide MySlide4 = null;
            try
            {

                MyPres = PPT.Presentations.Open(filePath, MsoTriState.msoFalse, MsoTriState.msoFalse, MsoTriState.msoTrue);//打开PPT

                #region 添加空白页
                MySlide = MyPres.Slides.Add(1, PpSlideLayout.ppLayoutBlank);//第一页
                MySlide2 = MyPres.Slides.Add(2, PpSlideLayout.ppLayoutBlank);//第二页
                MySlide3 = MyPres.Slides.Add(3, PpSlideLayout.ppLayoutBlank);//第三页
                MySlide4 = MyPres.Slides.Add(4, PpSlideLayout.ppLayoutBlank);//第四页
                #endregion

                #region 添加文本框
                TextRange MyTextRng = null;
                MySlide.Shapes.AddTextbox(MsoTextOrientation.msoTextOrientationHorizontal, 21.5F, 365F, 670F, 270F);
                //请注意此处Shapes的索引,由于文本框是第一个添加的Shapes,所以此处索引是1。
                MyTextRng = MySlide.Shapes[1].TextFrame.TextRange;
                MyTextRng.Font.NameFarEast = "微软雅黑";//文本框中,中文的字体
                MyTextRng.Font.NameAscii = "Calibri";//文本框中,英文和数字的字体
                MyTextRng.Text = "我是第一页的文本";//显示的内容
                MyTextRng.Font.Bold = MsoTriState.msoTrue;//是否加粗
                MyTextRng.Font.Color.RGB = 123 + 104 * 256 + 238 * 256 * 256;//字体颜色,其中ABC直接用自定义颜色中的数字代替即可。
                MyTextRng.Characters(1, 10).Font.Size = 24;//个性化设计。第1个字符开始,长度为10的字符,字体大小是24.
                MyTextRng.ParagraphFormat.Alignment = PpParagraphAlignment.ppAlignLeft;//文本对齐方式(水平方向)
                MySlide.Shapes[1].TextFrame.VerticalAnchor = MsoVerticalAnchor.msoAnchorMiddle; //文本对齐方式(垂直方向)
                #endregion

                #region 添加图形(矩形)
                MySlide2.Shapes.AddShape(MsoAutoShapeType.msoShapeRectangle, 8.5F, 6.5F, 705F, 525F);
                MySlide2.Shapes[1].Line.ForeColor.RGB = 230 + 230 * 256 + 250 * 256 * 256;//改变线条颜色
                MySlide2.Shapes[1].Fill.Transparency = 1;//控制填充色为透明
                MySlide2.Shapes[1].Line.Style = MsoLineStyle.msoLineSingle;//改变线型里的复合类型
                MySlide2.Shapes[1].Line.Weight = 1F;//改变线粗细
                MySlide2.Shapes[1].Shadow.Style = MsoShadowStyle.msoShadowStyleOuterShadow;//控制阴影类型
                MySlide2.Shapes[1].Shadow.ForeColor.RGB = 0;//控制阴影颜色
                MySlide2.Shapes[1].Shadow.Transparency = 0.6F;//控制透明度
                MySlide2.Shapes[1].Shadow.Size = 100F;//控制大小
                MySlide2.Shapes[1].Shadow.Blur = 4F;//控制虚化
                MySlide2.Shapes[1].Shadow.OffsetX = 2.1F;//控制距离;
                MySlide2.Shapes[1].Shadow.OffsetY = 2.1F;//与offsetX共同决定角度
                #endregion

                #region 添加图片
                string dirImg = AppDomain.CurrentDomain.BaseDirectory;
                dirImg = Path.GetFullPath("../..") + "\Image";
                string ImageFile = dirImg + "\草原.jpg";
                MySlide3.Shapes.AddPicture(ImageFile, MsoTriState.msoFalse, MsoTriState.msoTrue, 0, 0, 960F, 540F);
                #endregion

                #region 添加表格
                Table MyTable = null;
                MyTable = MySlide4.Shapes.AddTable(19, 5, 0, 0, 960F, 540F).Table;//创建时规定的宽和高,不是表格最终的大小。
                MyTable.Cell(9, 4).Shape.TextFrame.TextRange.Font.Size = 10;
                MyTable.Cell(9, 4).Shape.TextFrame.TextRange.Font.Color.RGB = 230 + 230 * 256 + 250 * 256 * 256;
                MyTable.Cell(9, 4).Shape.TextFrame.TextRange.Font.NameAscii = "Arial";
                MyTable.Cell(9, 4).Shape.TextFrame.TextRange.Font.NameFarEast = "微软雅黑";
                MyTable.Cell(9, 4).Shape.TextFrame.TextRange.Font.Bold = MsoTriState.msoTrue;
                MyTable.Cell(9, 4).Shape.TextFrame.TextRange.ParagraphFormat.Alignment = PpParagraphAlignment.ppAlignCenter;
                MyTable.Cell(9, 4).Shape.TextFrame.VerticalAnchor = MsoVerticalAnchor.msoAnchorMiddle;
                MyTable.Cell(9, 4).Shape.Fill.ForeColor.RGB = 0;
                MyTable.Cell(9, 4).Shape.TextFrame.TextRange.Text = "C#生成PPT";
                #endregion

                MyPres.SaveAs(dir + "\test-" + DateTime.Now.ToString("yyyyMMddhhmmss") + ".pptx");//保存文件

                Console.WriteLine("创建成功!");
                Console.ReadKey();
            }
            catch (Exception ex)
            {
                throw new Exception(ex.Message);
            }
            finally
            {
                try
                {
                    MyPres.Close();
                    PPT.Quit();
                }
                catch (Exception) { }
            }

        }
    }
5、效果展示
生成图表
Microsoft.Office.Interop.PowerPoint.Chart MyChart = null;//图表
Microsoft.Office.Interop.PowerPoint.ChartData MyChartData = null;//图表的数据源
Microsoft.Office.Interop.PowerPoint.Axis MyYvalaxis = null;//图表的纵坐标
Microsoft.Office.Interop.PowerPoint.Axis MyXvalaxis = null;//图表的横坐标
Microsoft.Office.Interop.PowerPoint.DataLabels MyDataLabels = null;//图表的数据标签
Microsoft.Office.Interop.PowerPoint.Series MySeries = null;//数据系列
Microsoft.Office.Interop.PowerPoint.ChartGroups MyChartGroups = null;//数据系列-系列选项
Microsoft.Office.Interop.PowerPoint.Points MyPoints = null; //数据系列
MyChart = MySlide.Shapes.AddChart(Microsoft.Office.Core.XlChartType.xlColumnClustered, 35F, 205F, 642F, 227F).Chart;//添加柱形图
MyChartData = MyChart.ChartData;//实例化数据源
Microsoft.Office.Interop.Excel.Workbook MyDataWorkbook_2 = (Microsoft.Office.Interop.Excel.Workbook)MyChartData.Workbook;//由于PPT的数据源是EXCEL工作表,所以此处还要调用EXCEL。
MyDataWorkbook_2.Application.WindowState = XlWindowState.xlMinimized;//不想看那么多窗口,所以最小化了。
Microsoft.Office.Interop.Excel.Worksheet MyDataWorksheet_2 = (Microsoft.Office.Interop.Excel.Worksheet)MyDataWorkbook_2.Worksheets[1];//实例化工作表
Microsoft.Office.Interop.Excel.Range tRange_2 = MyDataWorksheet_2.Cells.get_Range("A1", "C10");//选定数据区域
Microsoft.Office.Interop.Excel.ListObject tbl1_2 = MyDataWorksheet_2.ListObjects[1];
tbl1_2.Resize(tRange_2);
//赋值
((Microsoft.Office.Interop.Excel.Range)(MyDataWorksheet_2.Cells.get_Range("A2"))).FormulaR1C1 = "全国得分";
((Microsoft.Office.Interop.Excel.Range)(MyDataWorksheet_2.Cells.get_Range("A3"))).FormulaR1C1 = null;
//图表标题
MyChart.ChartTitle.Delete();
//纵轴
MyYvalaxis = (Microsoft.Office.Interop.PowerPoint.Axis)MyChart.Axes(Microsoft.Office.Interop.PowerPoint.XlAxisType.xlValue, Microsoft.Office.Interop.PowerPoint.XlAxisGroup.xlPrimary);
MyYvalaxis.MajorGridlines.Delete();//删除主横网络线
MyYvalaxis.MajorUnit = 0.5F;
MyYvalaxis.MinimumScale = 0.0F;
MyYvalaxis.MaximumScale = 1.5F;
MyYvalaxis.Format.Line.ForeColor.RGB = A + B * 256 + C * 256 * 256; ;//坐标轴颜色
MyYvalaxis.Format.Line.Transparency = 1F;//坐标轴是否透明;此句必须先指定颜色,否则无效
MyYvalaxis.TickLabels.Delete();//删除坐标标签
//横轴
MyXvalaxis = (Microsoft.Office.Interop.PowerPoint.Axis)MyChart.Axes(Microsoft.Office.Interop.PowerPoint.XlAxisType.xlCategory, Microsoft.Office.Interop.PowerPoint.XlAxisGroup.xlPrimary);
MyXvalaxis.MajorTickMark = Microsoft.Office.Interop.PowerPoint.XlTickMark.xlTickMarkOutside;//主要刻度线类型
MyXvalaxis.Format.Line.Weight = 0.75F;//线型宽度
MyXvalaxis.Format.Line.ForeColor.RGB = A + B * 256 + C * 256 * 256;//线条颜色
MyXvalaxis.TickLabelPosition = Microsoft.Office.Interop.PowerPoint.XlTickLabelPosition.xlTickLabelPositionNone;
//图例
MyChart.Legend.Delete();
//数据标签格式和系列
//系列1
MySeries = (Microsoft.Office.Interop.PowerPoint.Series)MyChart.SeriesCollection(1);
MySeries.HasDataLabels = true;
MySeries.Format.Fill.ForeColor.RGB = A + B * 256 + C * 256 * 256;
MySeries.Format.Line.ForeColor.RGB = A + B * 256 + C * 256 * 256;
MySeries.Format.Line.Weight = 1.5F;
MySeries.Format.Shadow.Style = MsoShadowStyle.msoShadowStyleOuterShadow;//控制阴影类型
MySeries.Format.Shadow.ForeColor.RGB = 0;//控制阴影颜色
MySeries.Format.Shadow.Transparency = 0.6F;//控制透明度
MySeries.Format.Shadow.Size = 100F;//控制大小
MySeries.Format.Shadow.Blur = 4F;//控制虚化
MySeries.Format.Shadow.OffsetX = 2.1F;//控制距离;
MySeries.Format.Shadow.OffsetY = 2.1F;//与offsetX共同决定角度
//柱子颜色
MyPoints = (Microsoft.Office.Interop.PowerPoint.Points)MySeries.Points();
MyPoints.Item(1).Format.Fill.ForeColor.RGB = A + B * 256 + B * 256 * 256;//系列1中,第1个柱子的颜色
//柱子距离
MyChartGroups = (Microsoft.Office.Interop.PowerPoint.ChartGroups)MyChart.ChartGroups();
MyChartGroups.Item(1).GapWidth = 50;
//数据标签
MyDataLabels = (Microsoft.Office.Interop.PowerPoint.DataLabels)MySeries.DataLabels();
MyDataLabels.Position = Microsoft.Office.Interop.PowerPoint.XlDataLabelPosition.xlLabelPositionOutsideEnd;
MyDataLabels.NumberFormat = "0.0%";
MyDataLabels.Format.TextFrame2.TextRange.Font.Size = 9F;
MyDataLabels.Format.TextFrame2.TextRange.Font.NameAscii = "Calibri";
MyDataLabels.Format.TextFrame2.TextRange.Font.Bold = MsoTriState.msoTrue;
//系列2
MySeries = (Microsoft.Office.Interop.PowerPoint.Series)MyChart.SeriesCollection(2);
MySeries.HasDataLabels = true;
MySeries.Format.Fill.ForeColor.RGB = A + B * 256 + C * 256 * 256;
MySeries.Format.Line.ForeColor.RGB = A + B * 256 + C * 256 * 256;
MySeries.Format.Line.Weight = 1.5F;
MySeries.Format.Shadow.Style = MsoShadowStyle.msoShadowStyleOuterShadow;//控制阴影类型
MySeries.Format.Shadow.ForeColor.RGB = 0;//控制阴影颜色
MySeries.Format.Shadow.Transparency = 0.6F;//控制透明度
MySeries.Format.Shadow.Size = 100F;//控制大小
MySeries.Format.Shadow.Blur = 4F;//控制虚化
MySeries.Format.Shadow.OffsetX = 2.1F;//控制距离
MySeries.Format.Shadow.OffsetY = 2.1F;//与offsetX共同决定角度
//柱子距离
MyChartGroups = (Microsoft.Office.Interop.PowerPoint.ChartGroups)MyChart.ChartGroups();
MyChartGroups.Item(1).GapWidth = 50;
//数据标签
MyDataLabels = (Microsoft.Office.Interop.PowerPoint.DataLabels)MySeries.DataLabels();
MyDataLabels.Position = Microsoft.Office.Interop.PowerPoint.XlDataLabelPosition.xlLabelPositionOutsideEnd;
MyDataLabels.NumberFormat = "0.0%";
MyDataLabels.Format.TextFrame2.TextRange.Font.Size = 9F;
MyDataLabels.Format.TextFrame2.TextRange.Font.NameAscii = "Calibri";
MyDataLabels.Format.TextFrame2.TextRange.Font.Italic = MsoTriState.msoTrue;