《Springboot Actuator之二:actuator在监控和管理指标的特性》
arthas的监控:
垃圾回收:垃圾回收次数gc.ps_scavenge.count、垃圾回收消耗时间gc.ps_scavenge.time、标记-清除算法的次数gc.ps_marksweep.count、标记-清除算法的消耗时间gc.ps_marksweep.time。
单次gc的时间:59348/2801=21ms
arthas
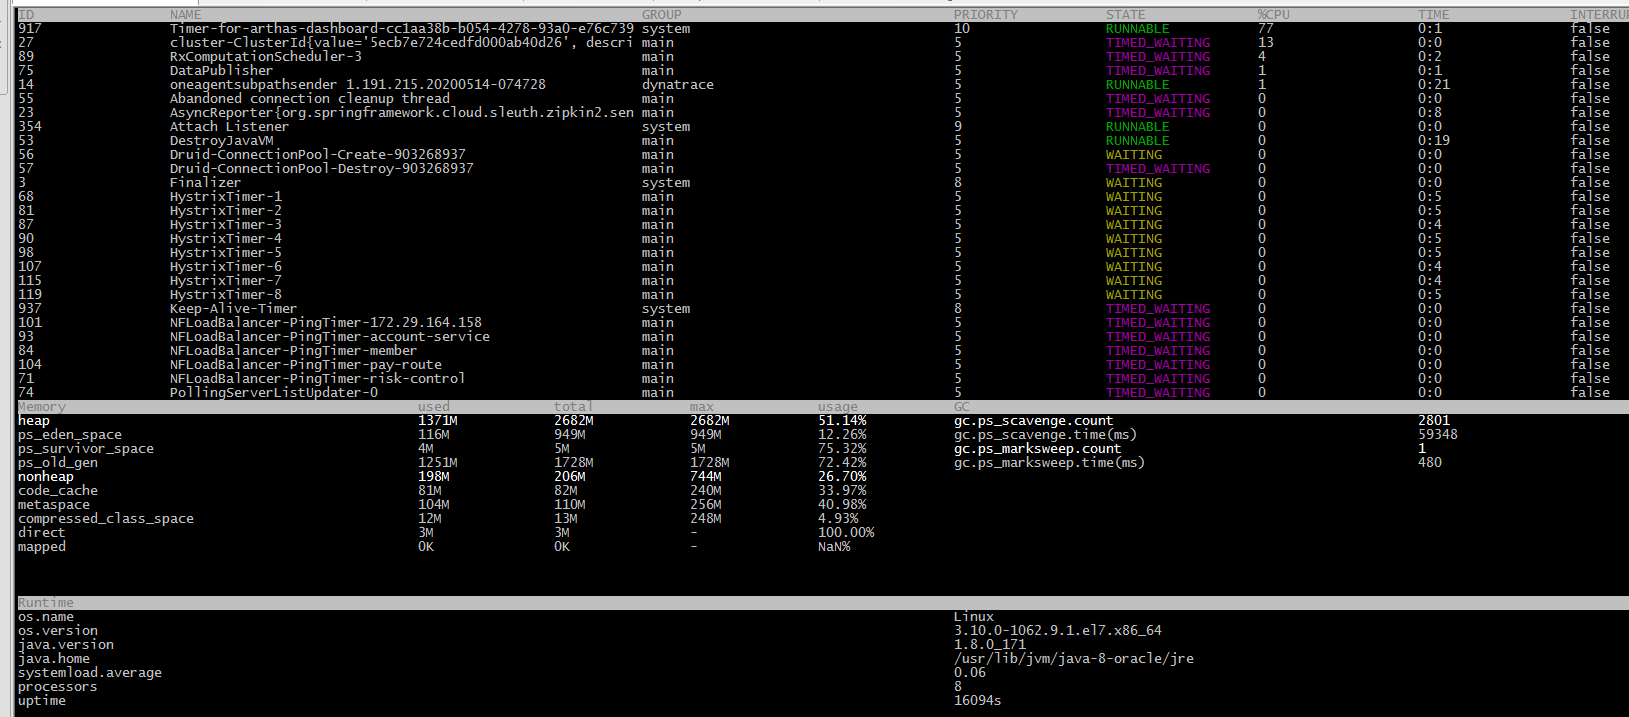
dashboard
当前系统的实时数据面板
线程信息(部分)、内存、GC次数、GC时间、基本信息

thread
显示线程信息
thread -n 指定最忙的前N个线程并打印堆栈

jvm
jvm的配置信息

sc
打印类的详细信息

打印类中详细信息以及变量信息

sm
查看已加载类的方法信息

查看方法的详细信息

monitor
非实时返回
-c :统计周期,默认为120秒
监控项:
timestamp 时间戳
class java类
mehtod 方法(构造方法、普通方法)
total 调用次数
success 成功次数
fail 失败次数
rt 平均rt
fail-rate 失败率
monitor class-pattern method pattern

trace
方法内部调用路径,并输出方法路径上的每个节点的耗时
trace class-pattern method-pattern -n #cost
trace *StringUtils isBlacnk '$cost>100'

stack
查看某个方法的调用路径-堆栈信息

watch
grovy 表达式

watch com.example.demo.arthas.ArthasInnerService test2 "{params.length,params[0],returnObj.age}" returnObj.books.size()>4
作者:仰望forward
链接:https://www.jianshu.com/p/0ed3c885eb7e
来源:简书
著作权归作者所有。商业转载请联系作者获得授权,非商业转载请注明出处。