https://www.percona.com/blog/2020/04/23/a-simple-approach-to-troubleshooting-high-cpu-in-mysql/
One of our customers recently asked whether it is possible to identify, from the MySQL side, the query that is causing high CPU usage on his system. The usage of simple OS tools to find the culprit has been a widely used technique for a long time by PostgreSQL and Oracle DBAs, but it didn’t work for MySQL as historically we’ve lacked the instrumentation to match an OS thread with an internal processlist thread – until recently.
Percona added support to map processlist ids to OS thread ids through column TID of the information_schema.processlist table starting on Percona Server for MySQL 5.6.27. With the release of 5.7, MySQL followed with its own implementation by extending the PERFORMANCE_SCHEMA.THREADS table and adding a new column named THREAD_OS_ID, which Percona Server for MySQL adopted in place of its own, as it usually does remain as close to upstream as possible.
The following approach is useful for cases where there is a query overloading one particular CPU while other cores are performing normally. For cases where it is a general CPU usage issue, different methods can be used, such as the one in this other blog post Reducing High CPU on MySQL: A Case Study.
How can we use this new column to find out which session is using the most CPU resources in my database?
Let’s use an example:
To troubleshoot CPU issues, we can use several tools, such as top or pidstat (requires the sysstat package). In the following example, we will use pidstat. The tool has an option (-t) that changes its view from process (the default) to threads, where it shows the associated threads within a given process. We can use it to find out which thread is consuming the most CPU in our server. Adding the -p parameter along with the mysql process id so the tool only shows MySQL threads, making it easier for us to troubleshoot. The last parameter (1) is to display one sample per second:
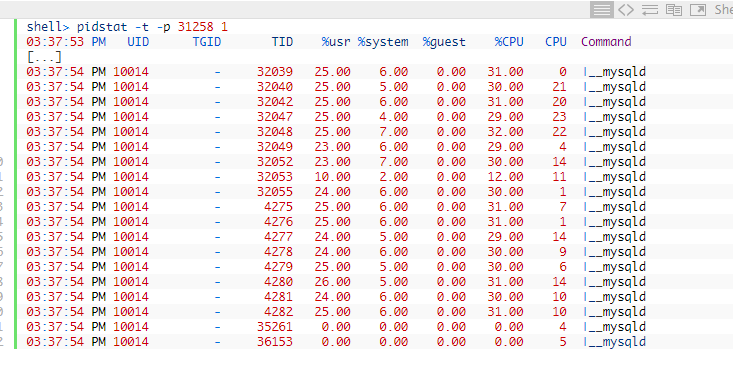
The command is pidstat -t -p <mysqld_pid> 1:

We can see that the thread 32053 is consuming the most CPU by quite a large margin, and we made sure to verify that the consumption is constant across multiple samples of pidstat. Using that information, we can log into the database and use the following query to find out which MySQL Thread is the culprit:
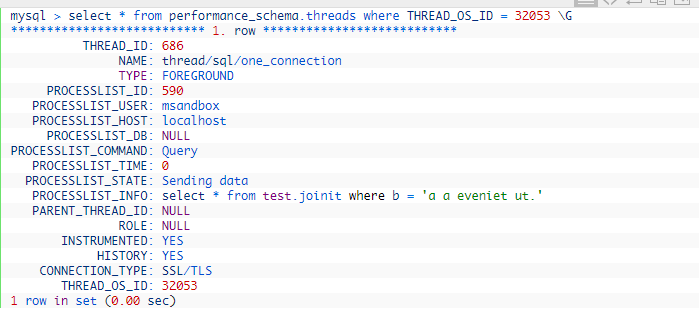
There we go! Now we know that the high CPU consumption comes from a query in the joinit table, being executed by the user msandbox from localhost in the database test. Using this information we can troubleshoot the query and check the execution plan with the EXPLAIN command to see if there is any room for improvement.

In this case, it was a simple index that was missing!
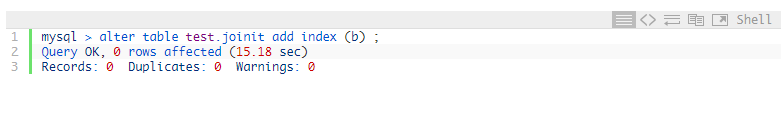
After we create the index, we are no longer seeing CPU spikes:
Why not use this approach to troubleshoot IO and Memory issues?
The issue with measuring thread IO from the OS side is that most of the MySQL IO operations are done by background threads, such as read, write, and page cleaner threads. To measure thread IO you can use tools like pidstat with the -d (IO instead of CPU) option or iostat with -H (per thread). If you have a very IO-consuming thread you might be able to see it, but be warned that the results can be misleading because of the background thread operations.
Memory consumption is an even trickier resource to measure from the OS side, as all memory is allocated under the MySQL process, and since it is MySQL that manages its memory access, it is transparent for the OS which thread is consuming the most memory. For this, we can use the perfomance_schema memory instrumentation available starting in 5.7.
Conclusion
There are many approaches to troubleshooting high CPU usage, but here we present a simple, widely-used approach on Oracle and PostgreSQL databases that can be adapted to MySQL, starting from version 5.7. By tracking down from the OS thread consumption to the database side, we can quickly detect CPU intensive queries that are affecting the system performance.
Correctly understanding the true cause of database performance problems allows for a quick and efficient resolution – yet enterprises often lack this crucial information. Without it, your solution could require more time and resources than necessary, or inefficiently address the issue. And contrary to popular belief, the problem is not always the database itself!
总结:
1)pidstat -t -p <mysqld_pid> 1: 找出CPU高的 THREAD_OS_ID ;
2) 根据 THREAD_OS_ID 查找到SQL文本;