-
遇到进程卡死,没有gdb 符号表;只能strace 跟踪处理分析
排查过程:
1、ps -aux 查看卡死进程pid
2、strace -T -tt -e trace=all -p 查看卡死进程系统调用信息
此时卡在read 系统调用上, read 的第一个参数为句柄
3、ls -l /proc/pid/fd
可以看到fd的指向的是哪个socket 或者文件以及innode
4、cat /proc/net/tcp 可以查看inode 信息
5、lsof 查看文件相关信息
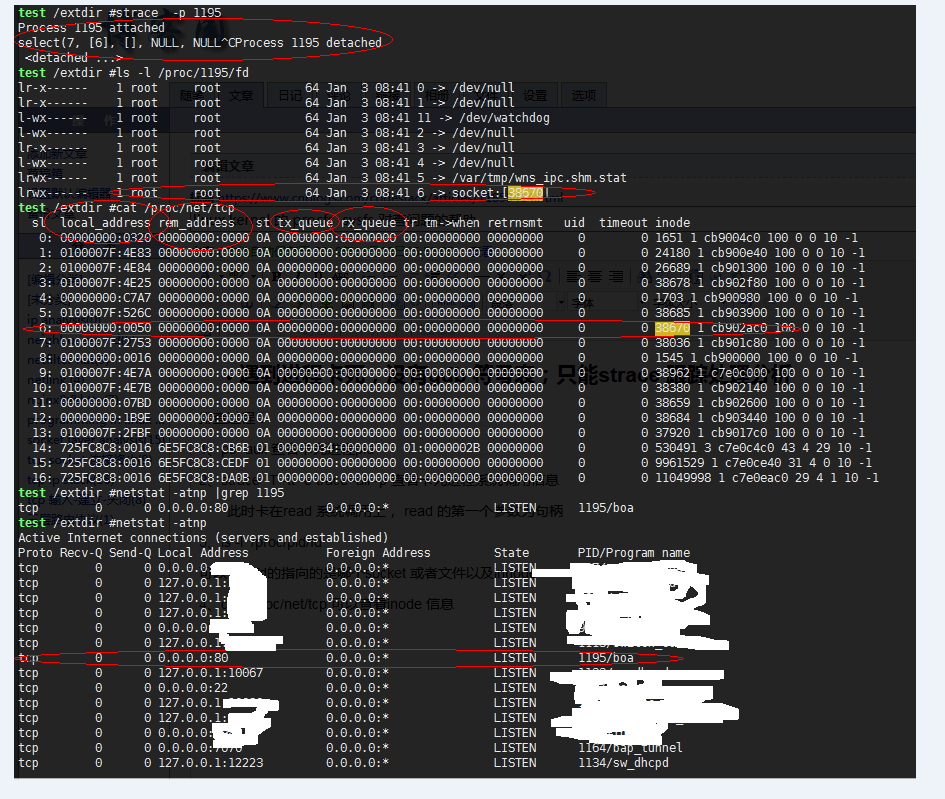
就可以根据fd 找到对应的连接
dynamic debug动态打印
 printk_once , 只打印一次。

     有些情况下,需要kernel运行时动态打印与否,dynamic debug就派上用场了。

     具体用法可以参考: kernel/Documentationdynamic-debug-howto.txt

     使用步骤:

       //  打印

       echo  'file nand.c line 4210 +p' > /sys/kernel/debug/dynamic_debug/control

       // 不打印
       echo  'file nand.c line 4210 -p' > /sys/kernel/debug/dynamic_debug/control

       // 使用例子

       pr_debug("  dynamic debug
");
kprobe:
* specify pre_handler address
 */
   kp.pre_handler=handler_pre;
/* specify post_handler address
 */
   kp.post_handler=handler_post;
/* specify fault_handler address
 */
   kp.fault_handler=handler_fault;
/* specify the address/offset where you want to insert probe.
 * You can get the address using one of the methods described above.
 */
   kp.addr = (kprobe_opcode_t *) kallsyms_lookup_name("do_fork");
/* check if the kallsyms_lookup_name() returned the correct value.
 */
   if (kp.add == NULL) {
       printk("kallsyms_lookup_name could not find address
                   for the specified symbol name
");
       return 1;
   }
/* or specify address directly.
 * $grep "do_fork" /usr/src/linux/System.map
 * or
 * $cat /proc/kallsyms |grep do_fork
 * or
 * $nm vmlinuz |grep do_fork
 */
   kp.addr = (kprobe_opcode_t *) 0xc01441d0;
/* All set to register with Kprobes
 */
       register_kprobe(&kp);

 然后在 init_moudle 中注册的探测器
Kprobes 的好处有很多。不需要重新编译和重新引导内核就可以插入 printk。为了进行调试可以记录 处理器寄存器的日志,甚至进行修改 —— 不会干扰系统。类似地,同样可以无干扰地记录 Linux 内核数据结构的日志,甚至 进行修改