Pandas的使用(1)
1.绘图
import pandas as pd
import numpy as np
import matplotlib.pyplot as plt
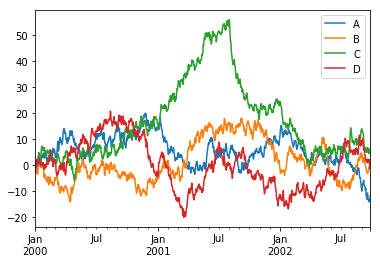
ts = pd.Series(np.random.randn(1000), index=pd.date_range('1/1/2000', periods=1000))
ts = ts.cumsum()
df = pd.DataFrame(np.random.randn(1000,4),index=ts.index,columns=['A','B','C','D'])
df = df.cumsum()
plt.figure(); df.plot(); plt.legend(loc='best')
运行结果为:
2.idioms
3.if-then..


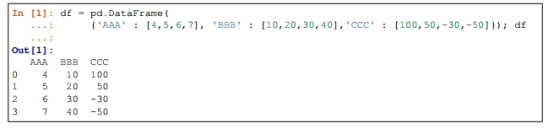
其中较为复杂的操作,根据一个dataframe的标记操作另外一个dataframe:
import pandas as pd
df = pd.DataFrame({'AAA' : [4,5,6,7], 'BBB' : [10,20,30,40],'CCC' : [100,50,-30,-50]})
print(df)
df_mask = pd.DataFrame({'AAA' : [True] * 4, 'BBB' : [False] * 4,'CCC' : [True,False]*2})
print(df_mask)
df1 = df.where(df_mask,-1000)
print(df1)
运行结果为:

结合numpy的where()方法来使用:
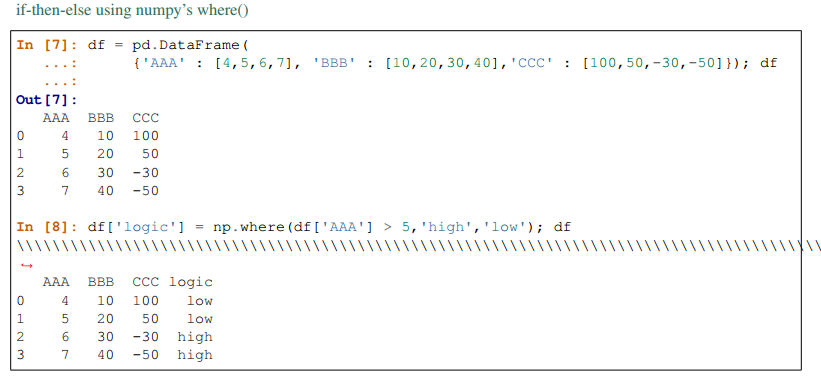
import pandas as pd
import numpy as np
df = pd.DataFrame({'AAA' : [4,5,6,7], 'BBB' : [10,20,30,40],'CCC' : [100,50,-30,-50]})
print(df)
df['logic'] = np.where(df['AAA'] > 5,'high','low');
print(df)
运行结果为:
