- 一、已经实现的收集器
- 1.1 可收集的内存指标
- 1.2 可收集的jetty指标
- 二、自定义收集
- 2.1 summer
- 2.2 histogram
- 三、架构设计
exporter作为Prometheus的探针,起到采集指标数据的功能。详细介绍可通过管网查询,此处不做累述,本文主要是在学习调研过程中将一些核心部分记录,供以后查询所用。
一、已经实现的收集器
1.1 可收集的内存指标


  1 # HELP jvm_buffer_pool_used_bytes Used bytes of a given JVM buffer pool.
  2 # TYPE jvm_buffer_pool_used_bytes gauge
  3 jvm_buffer_pool_used_bytes{pool="direct",} 8208.0
  4 jvm_buffer_pool_used_bytes{pool="mapped",} 0.0
  5 # HELP jvm_buffer_pool_capacity_bytes Bytes capacity of a given JVM buffer pool.
  6 # TYPE jvm_buffer_pool_capacity_bytes gauge
  7 jvm_buffer_pool_capacity_bytes{pool="direct",} 8208.0
  8 jvm_buffer_pool_capacity_bytes{pool="mapped",} 0.0
  9 # HELP jvm_buffer_pool_used_buffers Used buffers of a given JVM buffer pool.
 10 # TYPE jvm_buffer_pool_used_buffers gauge
 11 jvm_buffer_pool_used_buffers{pool="direct",} 2.0
 12 jvm_buffer_pool_used_buffers{pool="mapped",} 0.0
 13 # HELP jvm_threads_current Current thread count of a JVM
 14 # TYPE jvm_threads_current gauge
 15 jvm_threads_current 9.0
 16 # HELP jvm_threads_daemon Daemon thread count of a JVM
 17 # TYPE jvm_threads_daemon gauge
 18 jvm_threads_daemon 6.0
 19 # HELP jvm_threads_peak Peak thread count of a JVM
 20 # TYPE jvm_threads_peak gauge
 21 jvm_threads_peak 9.0
 22 # HELP jvm_threads_started_total Started thread count of a JVM
 23 # TYPE jvm_threads_started_total counter
 24 jvm_threads_started_total 10.0
 25 # HELP jvm_threads_deadlocked Cycles of JVM-threads that are in deadlock waiting to acquire object monitors or ownable synchronizers
 26 # TYPE jvm_threads_deadlocked gauge
 27 jvm_threads_deadlocked 0.0
 28 # HELP jvm_threads_deadlocked_monitor Cycles of JVM-threads that are in deadlock waiting to acquire object monitors
 29 # TYPE jvm_threads_deadlocked_monitor gauge
 30 jvm_threads_deadlocked_monitor 0.0
 31 # HELP jvm_threads_state Current count of threads by state
 32 # TYPE jvm_threads_state gauge
 33 jvm_threads_state{state="BLOCKED",} 0.0
 34 jvm_threads_state{state="TIMED_WAITING",} 1.0
 35 jvm_threads_state{state="WAITING",} 2.0
 36 jvm_threads_state{state="RUNNABLE",} 6.0
 37 jvm_threads_state{state="TERMINATED",} 0.0
 38 jvm_threads_state{state="NEW",} 0.0
 39 # HELP jvm_memory_pool_allocated_bytes_total Total bytes allocated in a given JVM memory pool. Only updated after GC, not continuously.
 40 # TYPE jvm_memory_pool_allocated_bytes_total counter
 41 # HELP jvm_gc_collection_seconds Time spent in a given JVM garbage collector in seconds.
 42 # TYPE jvm_gc_collection_seconds summary
 43 jvm_gc_collection_seconds_count{gc="PS Scavenge",} 0.0
 44 jvm_gc_collection_seconds_sum{gc="PS Scavenge",} 0.0
 45 jvm_gc_collection_seconds_count{gc="PS MarkSweep",} 0.0
 46 jvm_gc_collection_seconds_sum{gc="PS MarkSweep",} 0.0
 47 # HELP jvm_memory_bytes_used Used bytes of a given JVM memory area.
 48 # TYPE jvm_memory_bytes_used gauge
 49 jvm_memory_bytes_used{area="heap",} 1.5859424E7
 50 jvm_memory_bytes_used{area="nonheap",} 9558312.0
 51 # HELP jvm_memory_bytes_committed Committed (bytes) of a given JVM memory area.
 52 # TYPE jvm_memory_bytes_committed gauge
 53 jvm_memory_bytes_committed{area="heap",} 2.53231104E8
 54 jvm_memory_bytes_committed{area="nonheap",} 1.0682368E7
 55 # HELP jvm_memory_bytes_max Max (bytes) of a given JVM memory area.
 56 # TYPE jvm_memory_bytes_max gauge
 57 jvm_memory_bytes_max{area="heap",} 3.741319168E9
 58 jvm_memory_bytes_max{area="nonheap",} -1.0
 59 # HELP jvm_memory_bytes_init Initial bytes of a given JVM memory area.
 60 # TYPE jvm_memory_bytes_init gauge
 61 jvm_memory_bytes_init{area="heap",} 2.64241152E8
 62 jvm_memory_bytes_init{area="nonheap",} 2555904.0
 63 # HELP jvm_memory_pool_bytes_used Used bytes of a given JVM memory pool.
 64 # TYPE jvm_memory_pool_bytes_used gauge
 65 jvm_memory_pool_bytes_used{pool="Code Cache",} 1927488.0
 66 jvm_memory_pool_bytes_used{pool="Metaspace",} 6826936.0
 67 jvm_memory_pool_bytes_used{pool="Compressed Class Space",} 803888.0
 68 jvm_memory_pool_bytes_used{pool="PS Eden Space",} 1.5859424E7
 69 jvm_memory_pool_bytes_used{pool="PS Survivor Space",} 0.0
 70 jvm_memory_pool_bytes_used{pool="PS Old Gen",} 0.0
 71 # HELP jvm_memory_pool_bytes_committed Committed bytes of a given JVM memory pool.
 72 # TYPE jvm_memory_pool_bytes_committed gauge
 73 jvm_memory_pool_bytes_committed{pool="Code Cache",} 2555904.0
 74 jvm_memory_pool_bytes_committed{pool="Metaspace",} 7208960.0
 75 jvm_memory_pool_bytes_committed{pool="Compressed Class Space",} 917504.0
 76 jvm_memory_pool_bytes_committed{pool="PS Eden Space",} 6.6060288E7
 77 jvm_memory_pool_bytes_committed{pool="PS Survivor Space",} 1.1010048E7
 78 jvm_memory_pool_bytes_committed{pool="PS Old Gen",} 1.76160768E8
 79 # HELP jvm_memory_pool_bytes_max Max bytes of a given JVM memory pool.
 80 # TYPE jvm_memory_pool_bytes_max gauge
 81 jvm_memory_pool_bytes_max{pool="Code Cache",} 2.5165824E8
 82 jvm_memory_pool_bytes_max{pool="Metaspace",} -1.0
 83 jvm_memory_pool_bytes_max{pool="Compressed Class Space",} 1.073741824E9
 84 jvm_memory_pool_bytes_max{pool="PS Eden Space",} 1.380974592E9
 85 jvm_memory_pool_bytes_max{pool="PS Survivor Space",} 1.1010048E7
 86 jvm_memory_pool_bytes_max{pool="PS Old Gen",} 2.805989376E9
 87 # HELP jvm_memory_pool_bytes_init Initial bytes of a given JVM memory pool.
 88 # TYPE jvm_memory_pool_bytes_init gauge
 89 jvm_memory_pool_bytes_init{pool="Code Cache",} 2555904.0
 90 jvm_memory_pool_bytes_init{pool="Metaspace",} 0.0
 91 jvm_memory_pool_bytes_init{pool="Compressed Class Space",} 0.0
 92 jvm_memory_pool_bytes_init{pool="PS Eden Space",} 6.6060288E7
 93 jvm_memory_pool_bytes_init{pool="PS Survivor Space",} 1.1010048E7
 94 jvm_memory_pool_bytes_init{pool="PS Old Gen",} 1.76160768E8
 95 # HELP jvm_classes_loaded The number of classes that are currently loaded in the JVM
 96 # TYPE jvm_classes_loaded gauge
 97 jvm_classes_loaded 1194.0
 98 # HELP jvm_classes_loaded_total The total number of classes that have been loaded since the JVM has started execution
 99 # TYPE jvm_classes_loaded_total counter
100 jvm_classes_loaded_total 1194.0
101 # HELP jvm_classes_unloaded_total The total number of classes that have been unloaded since the JVM has started execution
102 # TYPE jvm_classes_unloaded_total counter
103 jvm_classes_unloaded_total 0.0
104 # HELP process_cpu_seconds_total Total user and system CPU time spent in seconds.
105 # TYPE process_cpu_seconds_total counter
106 process_cpu_seconds_total 0.8125
107 # HELP process_start_time_seconds Start time of the process since unix epoch in seconds.
108 # TYPE process_start_time_seconds gauge
109 process_start_time_seconds 1.586585865824E9
110 # HELP jvm_info JVM version info
111 # TYPE jvm_info gauge
112 jvm_info{version="1.8.0_211-b12",vendor="Oracle Corporation",runtime="Java(TM) SE Runtime Environment",} 1.0
1.2 可收集的jetty指标
 1 # HELP jetty_requests_total Number of requests
 2 # TYPE jetty_requests_total counter
 3 jetty_requests_total 0.0
 4 # HELP jetty_requests_active Number of requests currently active
 5 # TYPE jetty_requests_active gauge
 6 jetty_requests_active 0.0
 7 # HELP jetty_requests_active_max Maximum number of requests that have been active at once
 8 # TYPE jetty_requests_active_max gauge
 9 jetty_requests_active_max 0.0
10 # HELP jetty_request_time_max_seconds Maximum time spent handling requests
11 # TYPE jetty_request_time_max_seconds gauge
12 jetty_request_time_max_seconds 0.0
13 # HELP jetty_request_time_seconds_total Total time spent in all request handling
14 # TYPE jetty_request_time_seconds_total counter
15 jetty_request_time_seconds_total 0.0
16 # HELP jetty_dispatched_total Number of dispatches
17 # TYPE jetty_dispatched_total counter
18 jetty_dispatched_total 0.0
19 # HELP jetty_dispatched_active Number of dispatches currently active
20 # TYPE jetty_dispatched_active gauge
21 jetty_dispatched_active 0.0
22 # HELP jetty_dispatched_active_max Maximum number of active dispatches being handled
23 # TYPE jetty_dispatched_active_max gauge
24 jetty_dispatched_active_max 0.0
25 # HELP jetty_dispatched_time_max Maximum time spent in dispatch handling
26 # TYPE jetty_dispatched_time_max gauge
27 jetty_dispatched_time_max 0.0
28 # HELP jetty_dispatched_time_seconds_total Total time spent in dispatch handling
29 # TYPE jetty_dispatched_time_seconds_total counter
30 jetty_dispatched_time_seconds_total 0.0
31 # HELP jetty_async_requests_total Total number of async requests
32 # TYPE jetty_async_requests_total counter
33 jetty_async_requests_total 0.0
34 # HELP jetty_async_requests_waiting Currently waiting async requests
35 # TYPE jetty_async_requests_waiting gauge
36 jetty_async_requests_waiting 0.0
37 # HELP jetty_async_requests_waiting_max Maximum number of waiting async requests
38 # TYPE jetty_async_requests_waiting_max gauge
39 jetty_async_requests_waiting_max 0.0
40 # HELP jetty_async_dispatches_total Number of requested that have been asynchronously dispatched
41 # TYPE jetty_async_dispatches_total counter
42 jetty_async_dispatches_total 0.0
43 # HELP jetty_expires_total Number of async requests requests that have expired
44 # TYPE jetty_expires_total counter
45 jetty_expires_total 0.0
46 # HELP jetty_responses_total Number of requests with response status
47 # TYPE jetty_responses_total counter
48 jetty_responses_total{code="1xx",} 0.0
49 jetty_responses_total{code="2xx",} 0.0
50 jetty_responses_total{code="3xx",} 0.0
51 jetty_responses_total{code="4xx",} 0.0
52 jetty_responses_total{code="5xx",} 0.0
53 # HELP jetty_stats_seconds Time in seconds stats have been collected for
54 # TYPE jetty_stats_seconds gauge
55 jetty_stats_seconds 1.586586513759E9
56 # HELP jetty_responses_bytes_total Total number of bytes across all responses
57 # TYPE jetty_responses_bytes_total counter
58 jetty_responses_bytes_total 0.0
二、自定义收集
2.1 summer
基本度量标准名称为<basename>会在一次数据抓取期间显示多个时间序列:
streaming φ-quantiles (0 ≤ φ ≤ 1) of observed events, exposed as <basename>{quantile="<φ>"}
the total sum of all observed values, exposed as <basename>_sum
the count of events that have been observed, exposed as <basename>_count
|
测试实例:
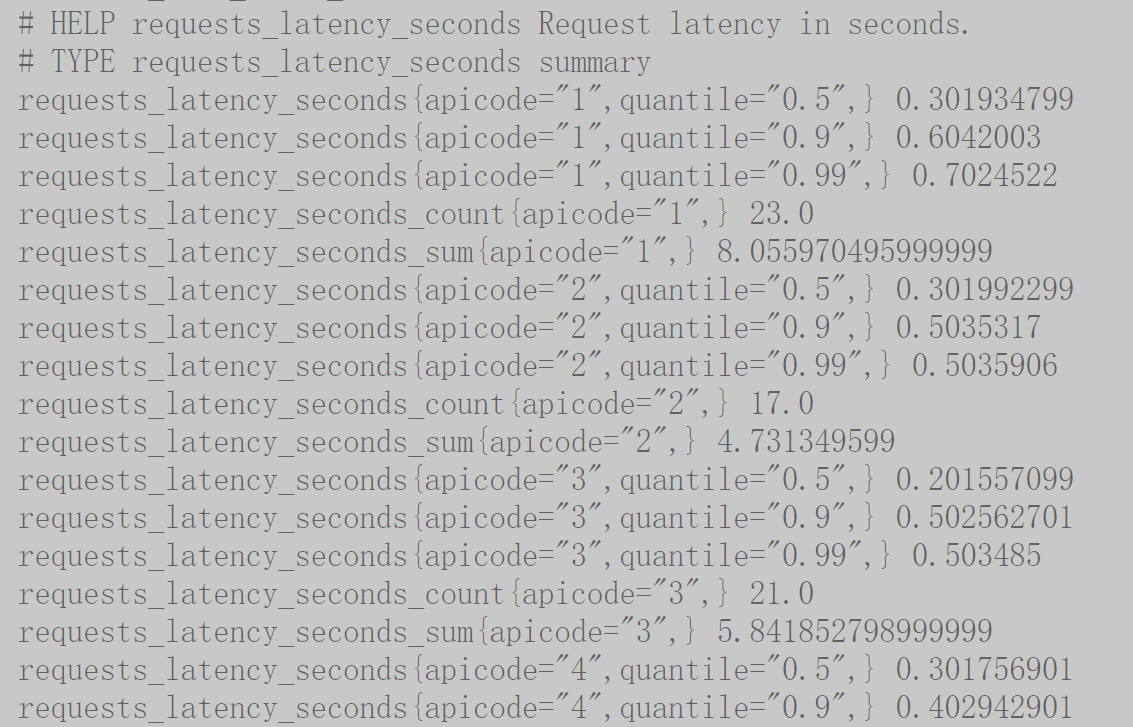
Summary可以指定在客户端统计的分位数,如下所示:
static final Summary requestLatency = Summary.build()
    .quantile(0.5, 0.05)   // 其中0.05为误差
    .quantile(0.9, 0.01)   // 其中0.01为误差
    .name("requests_latency_seconds").help("Request latency in seconds.").register();
|
2.2 histogram
基本度量标准名称为<basename>会在一次数据抓取期间显示多个时间序列:
cumulative counters for the observation buckets, exposed as <basename>_bucket{le="<upper inclusive bound>"}
the total sum of all observed values, exposed as <basename>_sum
the count of events that have been observed, exposed as <basename>_count (identical to <basename>_bucket{le="+Inf"} above)
|
测试实例: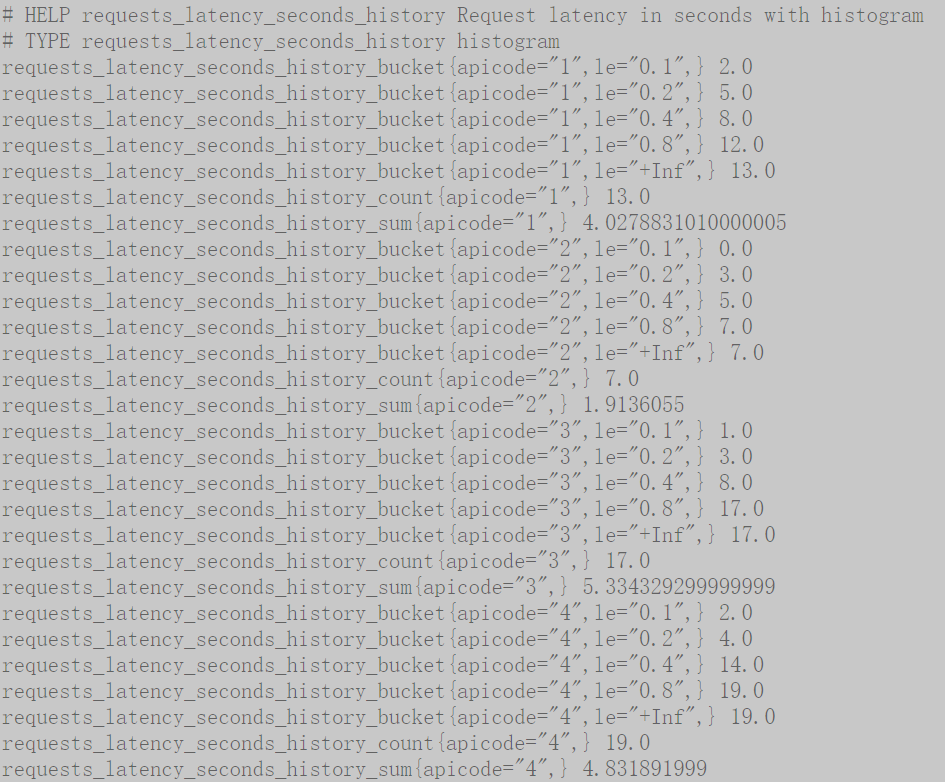
对于Histogram而言,默认的分布桶为[.005, .01, .025, .05, .075, .1, .25, .5, .75, 1, 2.5, 5, 7.5, 10],如果需要指定自定义的桶分布,可以使用buckets()方法指定,如下所示:
 static final Histogram requestLatency = Histogram.build()
            .name("requests_latency_seconds").help("Request latency in seconds.")
            .buckets(0.1, 0.2, 0.4, 0.8)
            .register();
|
2.3 summery和Histogram
它们之间一个重要的区别在于,Summary对quantile的计算是在client端完成的,而Histogram对quantile的计算是在server端完成的。这里client端是指使用了prometheus client library的模块。server端自然是指prometheus server。分析client library中对Summary的实现源码,不难发现summary对quantile的计算是依赖
CKMS实现的,参考的github地址:https://github.com/Netflix/ocelli/blob/master/ocelli-core/src/main/java/netflix/ocelli/stats/CKMSQuantiles.java(exporter——client对其进行修改部分地方),而此算法主要来自下面的一篇论文,
对算法感兴趣的可以自行研究,http://www.cs.rutgers.edu/~muthu/bquant.pdf 而Histogram对quantile的计算是在prometheus server端进行的,对histogram_quantile函数的计算是在server端完成的。所以很显然,client端处理summary的消耗比Histogram大,server端则正好反过来,
Summary和Histogram对quantile的处理的区别可以总结如下:
-
Summary不能对quantile值进行aggregation操作,而Histogram则可以;所以如果针对多实例的场景计算quantile,只能使用Histogram;
histogram_quantile() :histogram_quantile(φ float, b instant-vector)#计算最近10m的请求持续时间的90%分位数(每种label组合计算出一个分位数) histogram_quantile(0.9, rate(http_request_duration_seconds_bucket[10m])) #聚合标签le分位数(所有label组合计算出一个分位数) histogram_quantile(0.9, sum(rate(http_request_duration_seconds_bucket[10m])) by (le)) #聚合标签job的分位数 histogram_quantile(0.9, sum(rate(http_request_duration_seconds_bucket[10m])) by (job, le))
PS:If
bcontains fewer than two buckets,NaNis returned. For φ < 0,-Infis returned. For φ > 1,+Infis returned.为什么不能对Summary产生的quantile值进行aggregation运算(例如sum, avg等)。例如有两个实例同时运行,都对外提供服务,分别统计各自的响应时间。最后分别计算出的0.5-quantile的值为60和80,这时如果简单的求平均(60+80)/2,认为是总体的0.5-quantile值,那么就错了。如果你闭上眼睛,简单思考一下,就会明白对两个quantile值求平均毫无意义。所以如果需要对多个实例的quantile值进行aggregation操作,那么就不能使用Summary。
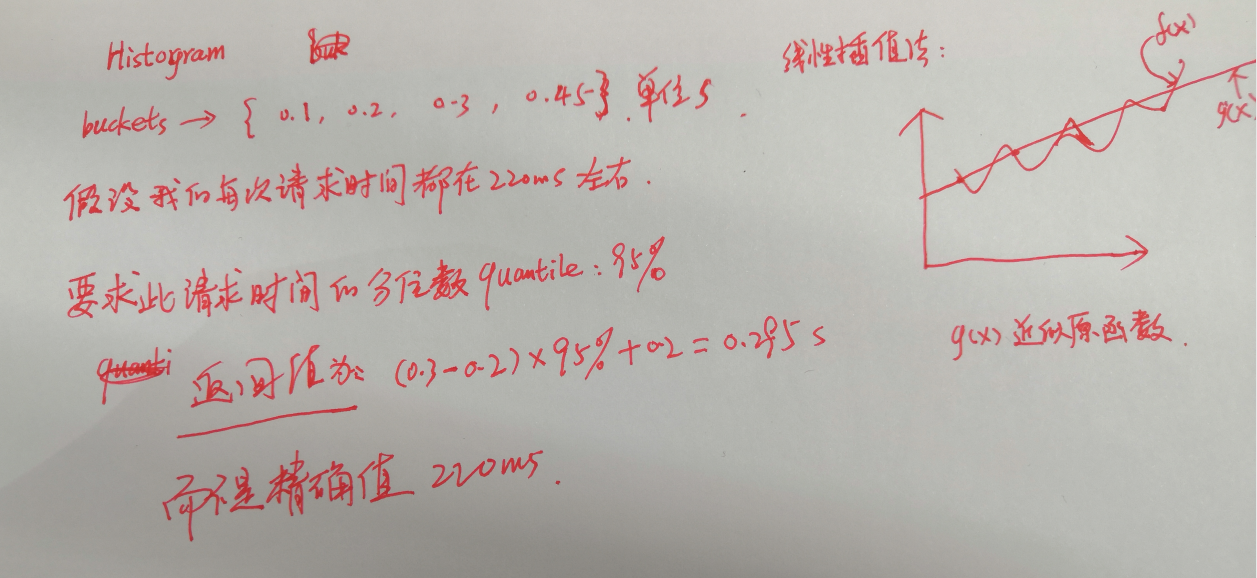
2. 如果histogram的bucket设置不合理,则最后误差可能会很大;所以如果需要相对精确的结果,而且是单实例场景,那么就使用Summary;
3.Summary对quantile的计算是在client端通过第三方库perks做的;而Histogram对quantile的计算则是server端完成的。
三、架构设计
HTTPServer内部实现如下所示:
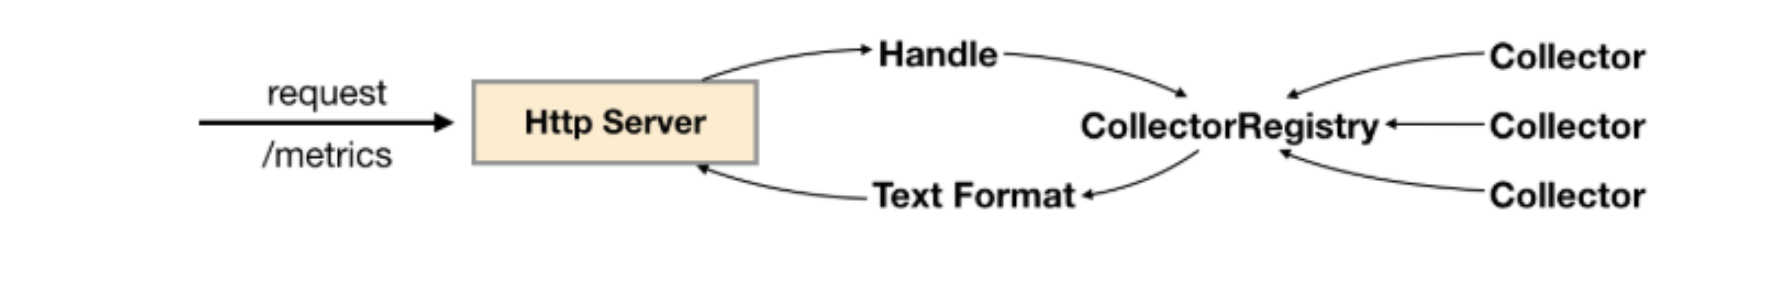
当调用Collector实例register()方法时,会将该实例保存到CollectorRegistry当中,CollectorRegistry负责维护当前系统中所有的Collector实例。 HTTPServer在接收到HTTP请求之后,会从CollectorRegistry中拿到所有的Collector实例,并调用其collect()方法获取所有样本,最后格式化为Prometheus的标准输出。
除了直接使用HTTPServer以外暴露样本数据以外,client_java中还提供了对Spring Boot、Spring Web以及Servlet的支持。