import matplotlib.pyplot as plt
import numpy as np
x = np.linspace(0, 2 * np.pi, 50)
y = np.sin(x)
plt.plot(x, y)
plt.show()

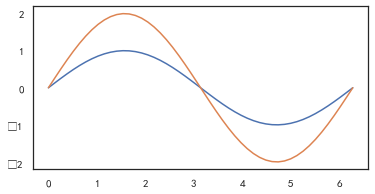
#在一张图纸里绘制多个图形,一起跑就OK了,简简单单
plt.plot(x, y)
plt.plot(x, y * 2)
plt.show()
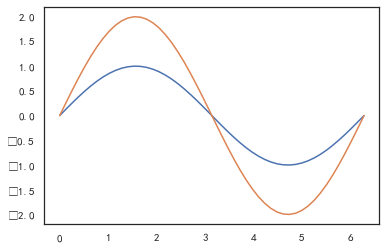
#设置 figure,也就是图的尺寸,加上上面一张图绘制多个图形
plt.figure(figsize=(6, 3))
plt.plot(x, y)
plt.plot(x, y * 2)
plt.show()
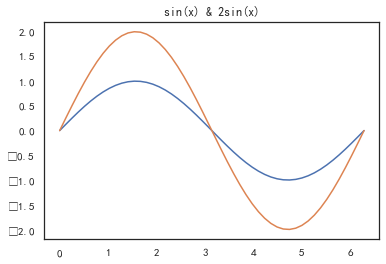
#设置标题,plt.title(),简单起飞
plt.plot(x, y)
plt.plot(x, y * 2)
plt.title("sin(x) & 2sin(x)")
plt.show()
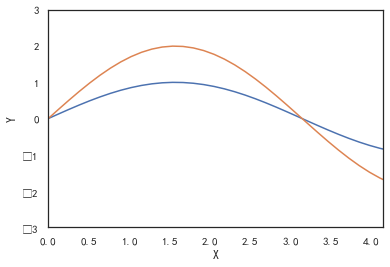
#设置坐标轴
plt.plot(x, y)
plt.plot(x, y * 2)
plt.xlim((0, np.pi + 1))  #坐标刻度范围
plt.ylim((-3, 3))  #坐标刻度范围
plt.xlabel('X')   #坐标名称
plt.ylabel('Y')  #坐标名称
plt.show()
#xticks 和 yticks 来设置轴的刻度
plt.plot(x, y)
plt.plot(x, y * 2)
plt.xticks((0, np.pi * 0.5, np.pi, np.pi * 1.5, np.pi * 2))
plt.show()

#设置 label 和 legend 的目的就是为了区分出每个数据对应的图形名称,一定要和legend()一起跑,不然是没有名称的
plt.plot(x, y, label="sin(x)")
plt.plot(x, y * 2, label="2sin(x)")
plt.legend()
plt.show()

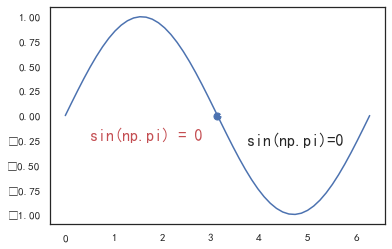
#有时候我们需要对特定的点进行标注,我们可以使用 plt.annotate 函数来实现,
#我们也可以使用 plt.text 函数来添加注释
plt.plot(x, y)
x0 = np.pi
y0 = 0
plt.scatter(x0, y0, s=50)
plt.annotate('sin(np.pi)=%s' % y0, xy=(np.pi, 0), xycoords='data', xytext=(+30, -30),
             textcoords='offset points', fontsize=16,
             arrowprops=dict(arrowstyle='->', connectionstyle="arc3,rad=.2"))
plt.text(0.5, -0.25, "sin(np.pi) = 0", fontdict={'size': 16, 'color': 'r'})
plt.show()
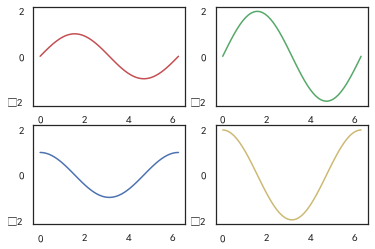
#有时候我们需要将多张子图展示在一起,可以使用 subplot() 实现。即在调用 plot() 函数之前需要先调用 subplot() 函数。该函数的第一个参数代表子图的总行数,第二个参数代表子图的总列数,第三个参数代表活跃区域
ax1 = plt.subplot(2, 2, 1) # (行,列,活跃区)
plt.plot(x, np.sin(x), 'r')

ax2 = plt.subplot(2, 2, 2, sharey=ax1) # 与 ax1 共享y轴
plt.plot(x, 2 * np.sin(x), 'g')

ax3 = plt.subplot(2, 2, 3)
plt.plot(x, np.cos(x), 'b')

ax4 = plt.subplot(2, 2, 4, sharey=ax3) # 与 ax3 共享y轴
plt.plot(x, 2 * np.cos(x), 'y')

plt.show()
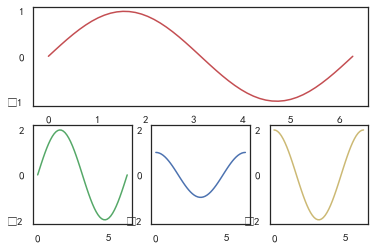
#上面的 subplot(2, 2, x) 表示将图像窗口分为 2 行 2 列。x 表示当前子图所在的活跃区。
#可以看到,上面的每个子图的大小都是一样的。有时候我们需要不同大小的子图。比如将上面第一张子图完全放置在第一行,其他的子图都放在第二行
ax1 = plt.subplot(2, 1, 1) # (行,列,活跃区)
plt.plot(x, np.sin(x), 'r')

ax2 = plt.subplot(2, 3, 4)
plt.plot(x, 2 * np.sin(x), 'g')

ax3 = plt.subplot(2, 3, 5, sharey=ax2)
plt.plot(x, np.cos(x), 'b')

ax4 = plt.subplot(2, 3, 6, sharey=ax2)
plt.plot(x, 2 * np.cos(x), 'y')

plt.show()